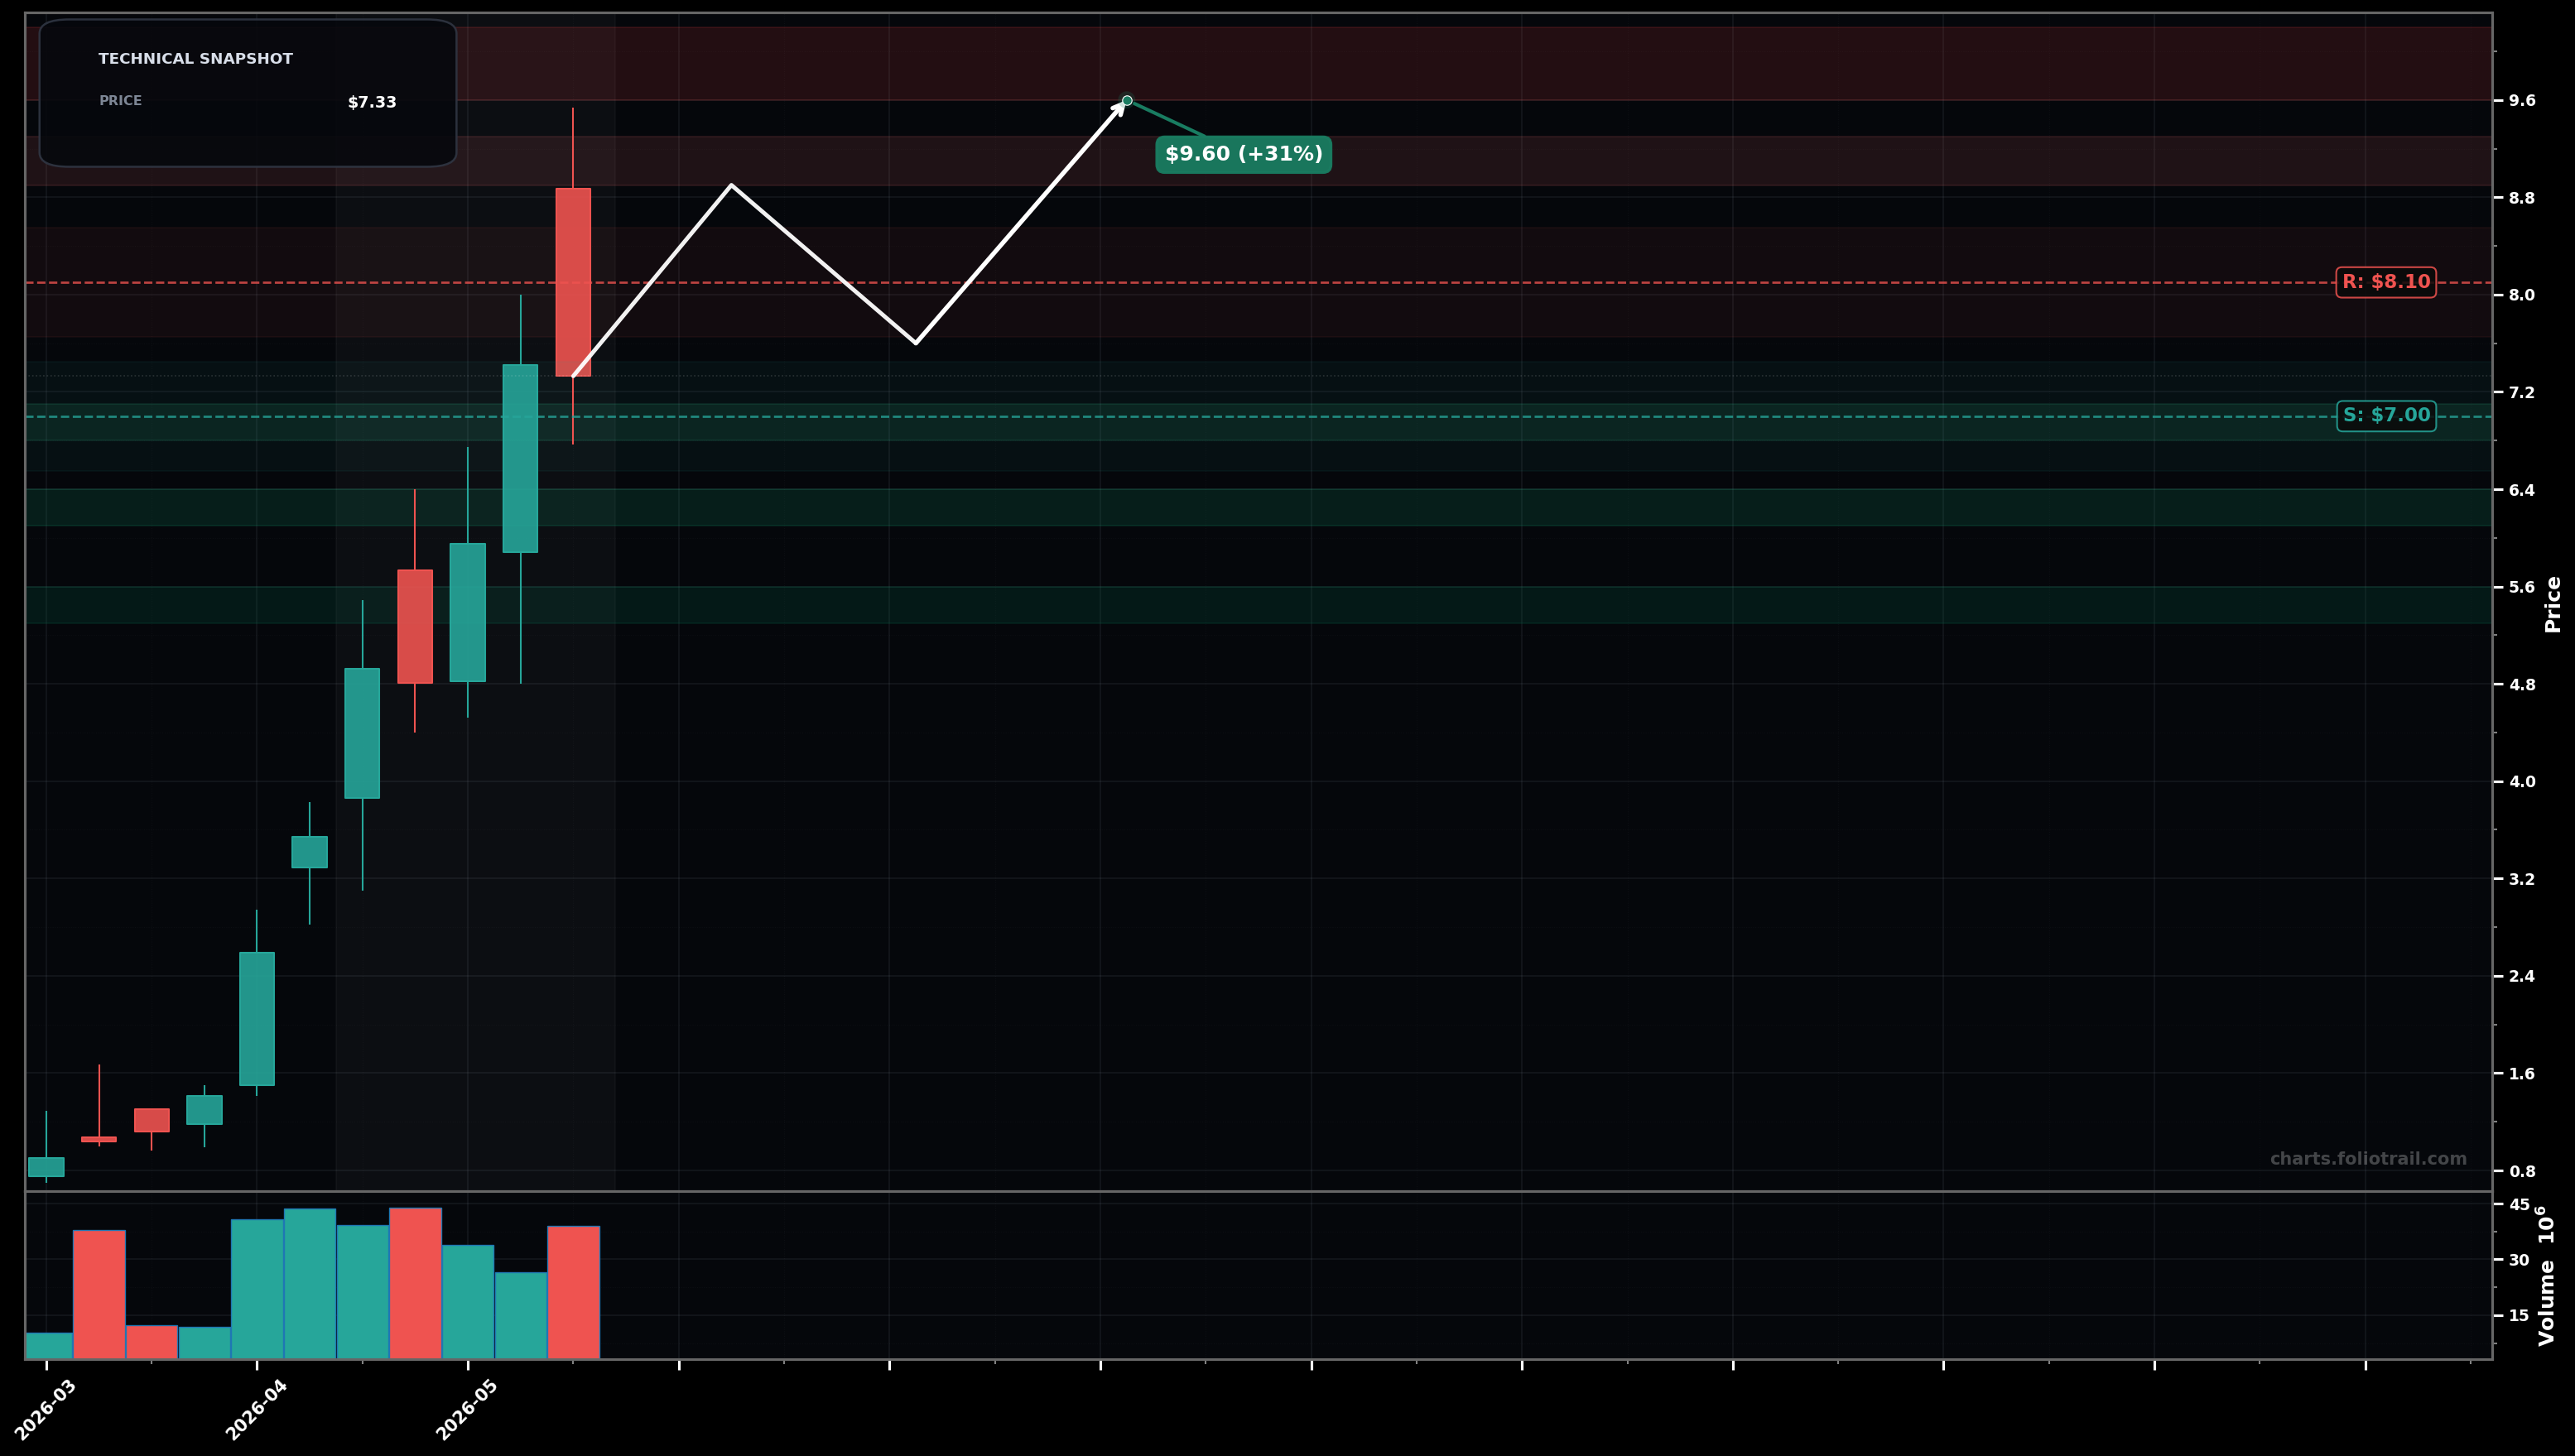
As of May 31, 2026, SIVEF (Sivers Semiconductors AB (publ)) is in a volatility expansion state on the weekly chart, with a confidence level of 66%. Key support is at $7.00 and key resistance at $8.10. Strong multi-week rally followed by a sharp pullback week from near $9.0s to a ~$7.33 close (profit-taking after a steep advance).
Bullish continuation: pullback holds above the prior breakout/structure (~$7.0), then price reclaims ~$8.1 and retests the prior high zone; this would look like Elliott Wave (4) pullback before a Wave (5) push.
Deeper correction: failure to hold ~$7.0 leads to a retrace toward the mid-breakout area; potential Elliott ABC correction with buyers defending prior consolidation.
VOLATILITY_EXPANSION confirmed if weekly closes continue to swing outside ~$6.90–$8.10 with expanding ranges; next confirm on a close below $6.90 or above $8.10.
Invalidated if price compresses and holds a tight weekly range between $7.00–$7.80 for 3+ weeks (shifts toward STABILIZED_BASE).
Scale near the most recent swing/round-number support (~$7.0), add on a typical Fib-style retrace into prior breakout ($6.1–$6.4), heavy add only if a deeper ABC flush tests the earlier base zone ($5.3–$5.6).
Trim into prior high/extension zone ($8.9–$9.3), trim more on a clean breakout-extension ($9.6–$10.2), and consider full exit only on euphoric multi-year stretch/overshoot beyond prior highs ($10.8+).
As of May 31, 2026, SIVEF (Sivers Semiconductors AB (publ)) is in a volatility expansion state on the weekly chart with 66% confidence. Strong multi-week rally followed by a sharp pullback week from near $9.0s to a ~$7.33 close (profit-taking after a steep advance).
On the weekly timeframe, SIVEF has key support at $7.00 and key resistance at $8.10. The most likely scenario (bullish) targets $8.90 and $9.60, with a revert level at $7.60.
SIVEF (Sivers Semiconductors AB (publ)) is currently classified as volatility expansion on the weekly chart, with 66% confidence. Confirmation requires: VOLATILITY_EXPANSION confirmed if weekly closes continue to swing outside ~$6.90–$8.10 with expanding ranges; next confirm on a close below $6.90 or above $8.10. This would be invalidated by: Invalidated if price compresses and holds a tight weekly range between $7.00–$7.80 for 3+ weeks (shifts toward STABILIZED_BASE).
The most likely scenario (bullish) targets $8.90 and $9.60, with a revert level at $7.60. The alternative scenario (bearish) targets $6.30 and $5.50.
Multi-layer AI agents analyse 200+ stocks across daily, weekly, and monthly timeframes — producing market state classifications, price scenarios with targets, and position entry/exit levels. Daily charts updated every trading day at 6 PM ET. Weekly charts refresh Fridays. Monthly charts refresh on the last trading day of each month. No paywall. No sign-up required.
Built by Foliotrail.
All content on this website — including charts, analysis, price targets, support/resistance levels, and position zones — is generated entirely by AI and provided for educational and informational purposes only.
This is not financial advice. NEXUSNOIR VENTURES SL (the operator of this website) is not a registered investment adviser or broker-dealer. You should not make investment decisions based solely on this information. Always do your own research and consult a qualified financial advisor.
By continuing, you acknowledge that you have read and agree to our full disclaimer & terms of use and privacy policy.