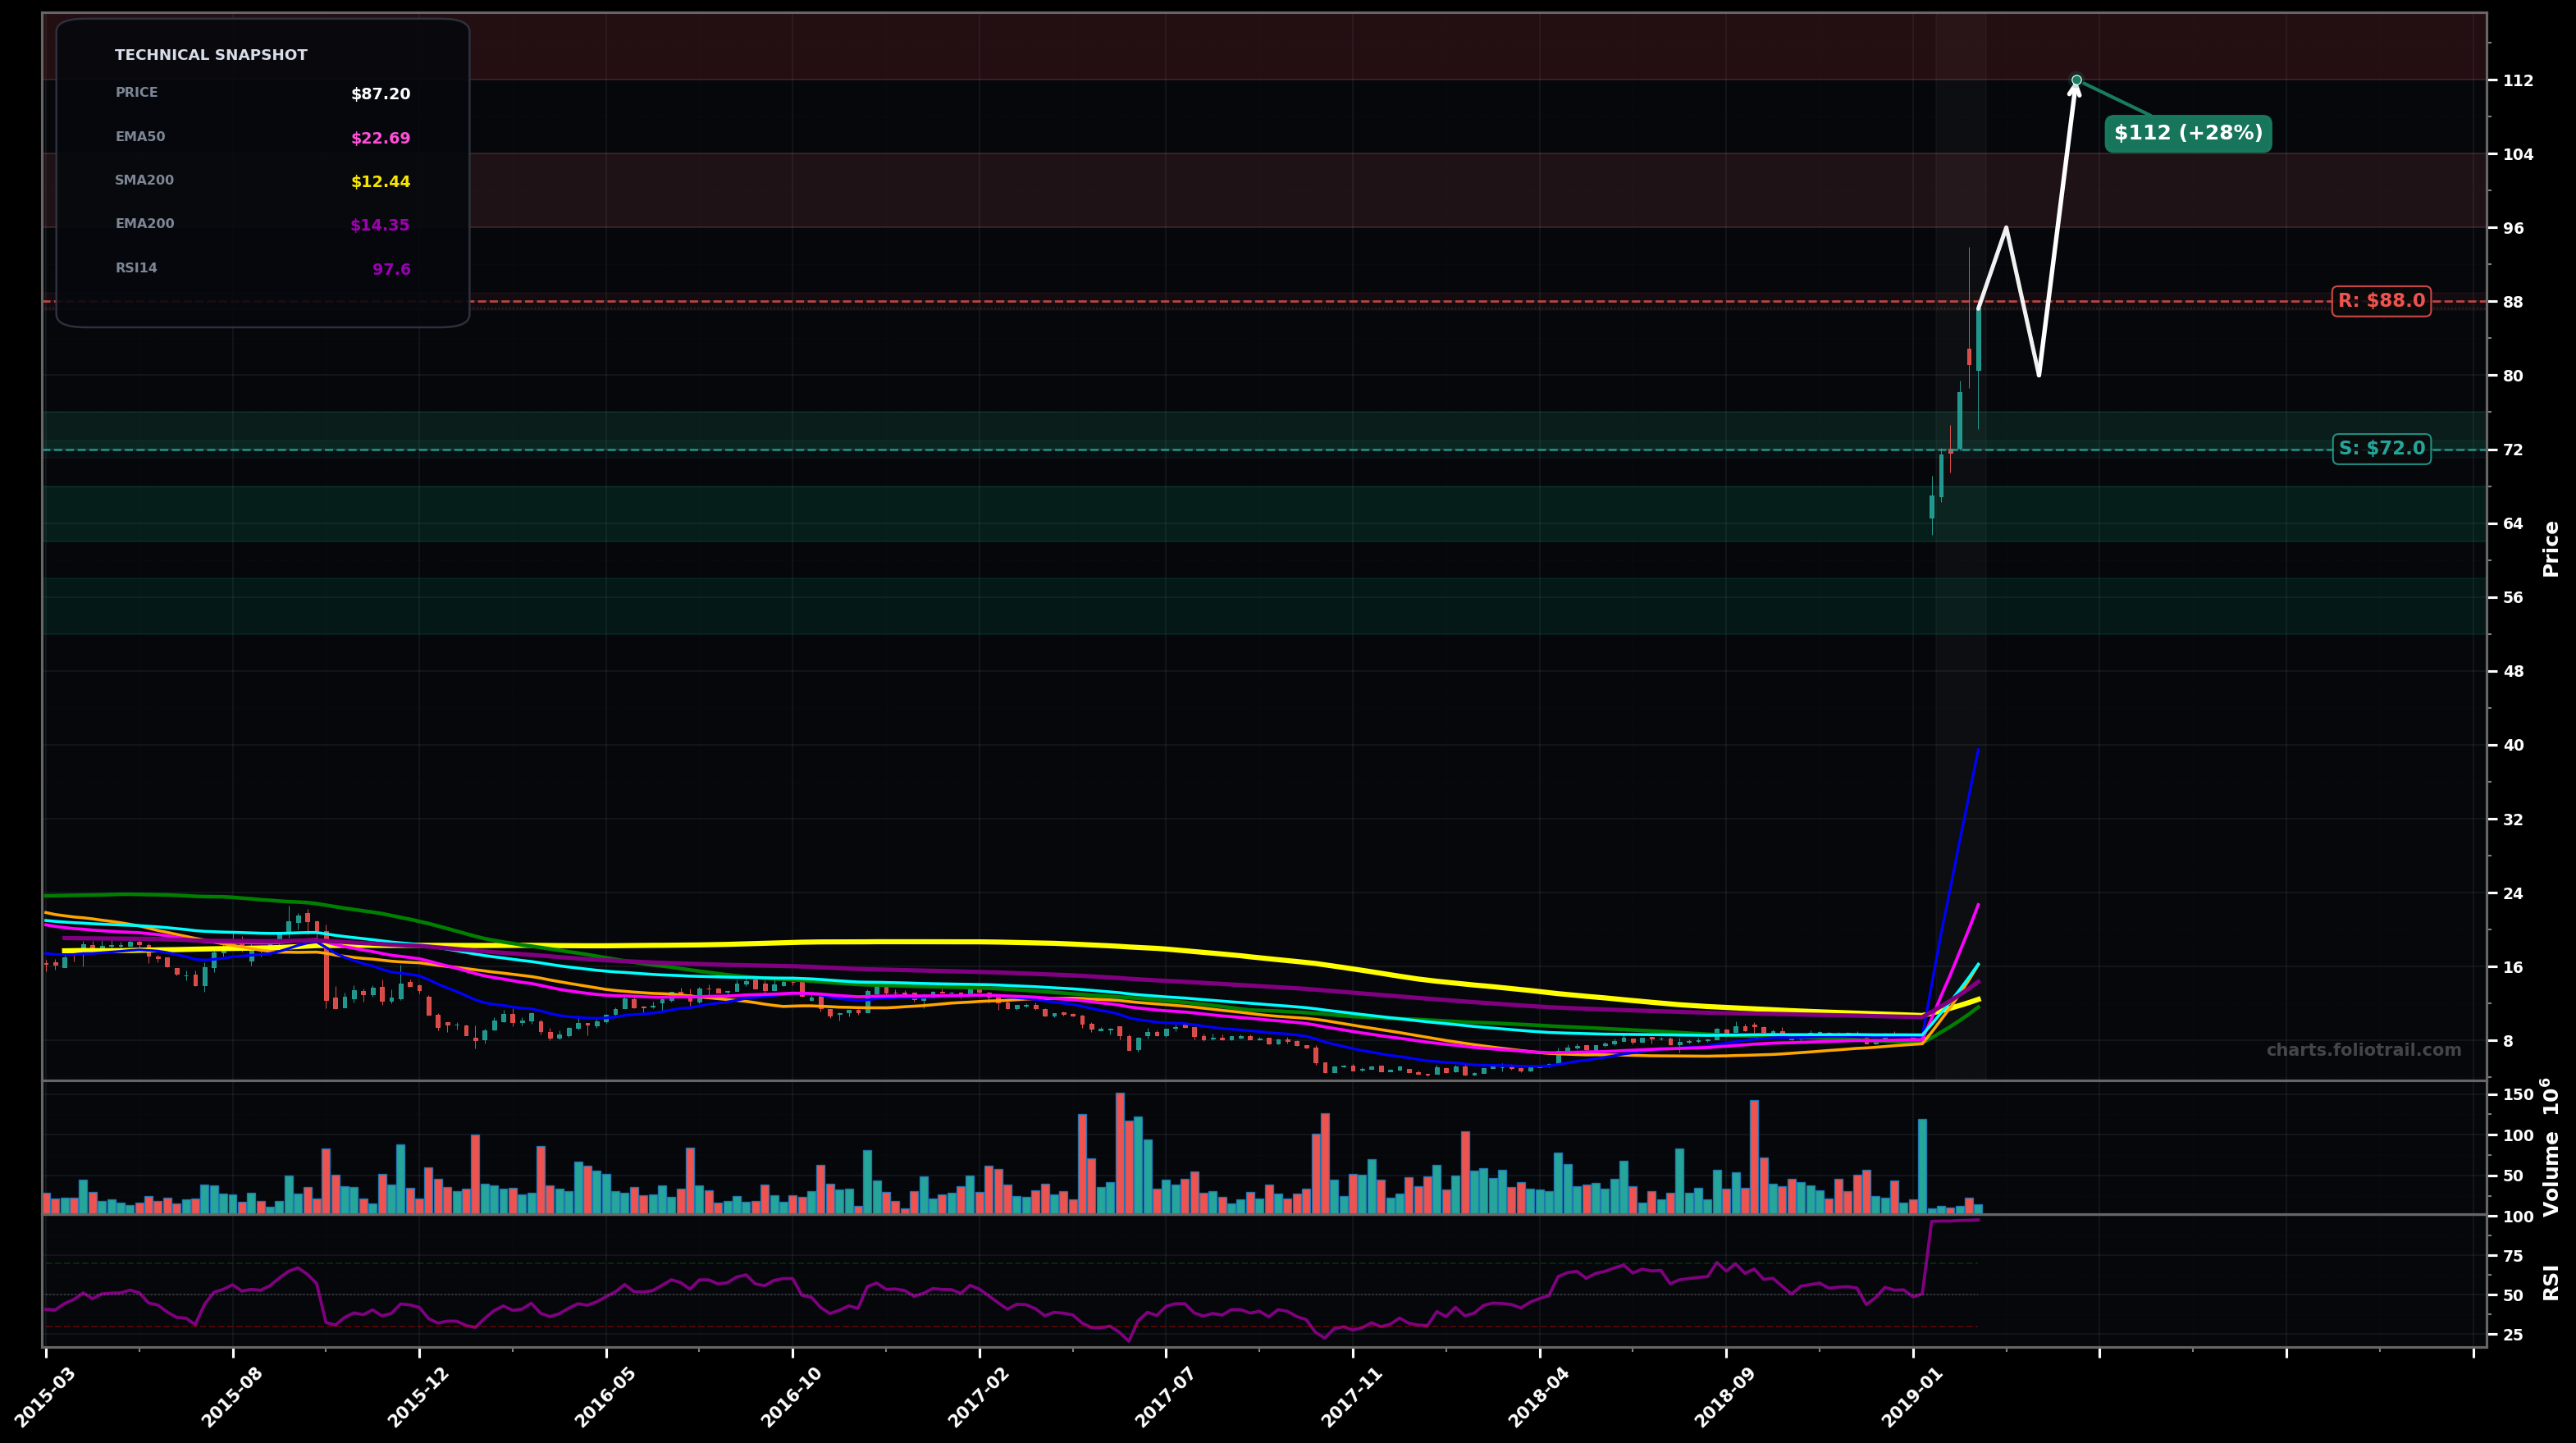
As of May 22, 2026, P (Everpure Inc.) is in a parabolic state on the weekly chart, with a confidence level of 84%. Key support is at $72.0 and key resistance at $88.0. Weekly vertical breakout with multi-week green surge to ~$87; RSI ~97 indicates extreme momentum/overbought and high reversal risk.
Parabolic continuation (Elliott: extended Wave 3/5 behavior) with a brief pause then push to the next fib extensions before a larger Wave 4-style pullback.
Blow-off top then sharp mean-reversion (Elliott: Wave 5 completion) into a deeper weekly pullback toward the breakout origin/major MAs; bounce attempts likely but choppy.
Weekly close above $88 with follow-through toward $96+
Weekly close back below $72 (loss of the breakout shelf/first impulse base)
Prefer buying pullbacks: $72-$76 is first impulse base/support; $62-$68 aligns with deeper fib retrace zone of the vertical leg; $52-$58 is a capitulation/mean-revert zone if Wave 4 becomes deeper.
Trim into fib-extension resistance during parabolic conditions (RSI extreme, far above EMA stack); escalate trimming on extensions to reduce drawdown risk from a Wave 4/Wave A-B-C reset.
As of May 22, 2026, P (Everpure Inc.) is in a parabolic state on the weekly chart with 84% confidence. Weekly vertical breakout with multi-week green surge to ~$87; RSI ~97 indicates extreme momentum/overbought and high reversal risk.
On the weekly timeframe, P has key support at $72.0 and key resistance at $88.0. The most likely scenario (bullish) targets $96.0 and $112, with a revert level at $80.0.
P (Everpure Inc.) is currently classified as parabolic on the weekly chart, with 84% confidence. Confirmation requires: Weekly close above $88 with follow-through toward $96+ This would be invalidated by: Weekly close back below $72 (loss of the breakout shelf/first impulse base)
The most likely scenario (bullish) targets $96.0 and $112, with a revert level at $80.0. The alternative scenario (bearish) targets $72.0 and $56.0.
Multi-layer AI agents analyse 200+ stocks across daily, weekly, and monthly timeframes — producing market state classifications, price scenarios with targets, and position entry/exit levels. Daily charts updated every trading day at 6 PM ET. Weekly charts refresh Fridays. Monthly charts refresh on the last trading day of each month. No paywall. No sign-up required.
Built by Foliotrail.
All content on this website — including charts, analysis, price targets, support/resistance levels, and position zones — is generated entirely by AI and provided for educational and informational purposes only.
This is not financial advice. NEXUSNOIR VENTURES SL (the operator of this website) is not a registered investment adviser or broker-dealer. You should not make investment decisions based solely on this information. Always do your own research and consult a qualified financial advisor.
By continuing, you acknowledge that you have read and agree to our full disclaimer & terms of use and privacy policy.