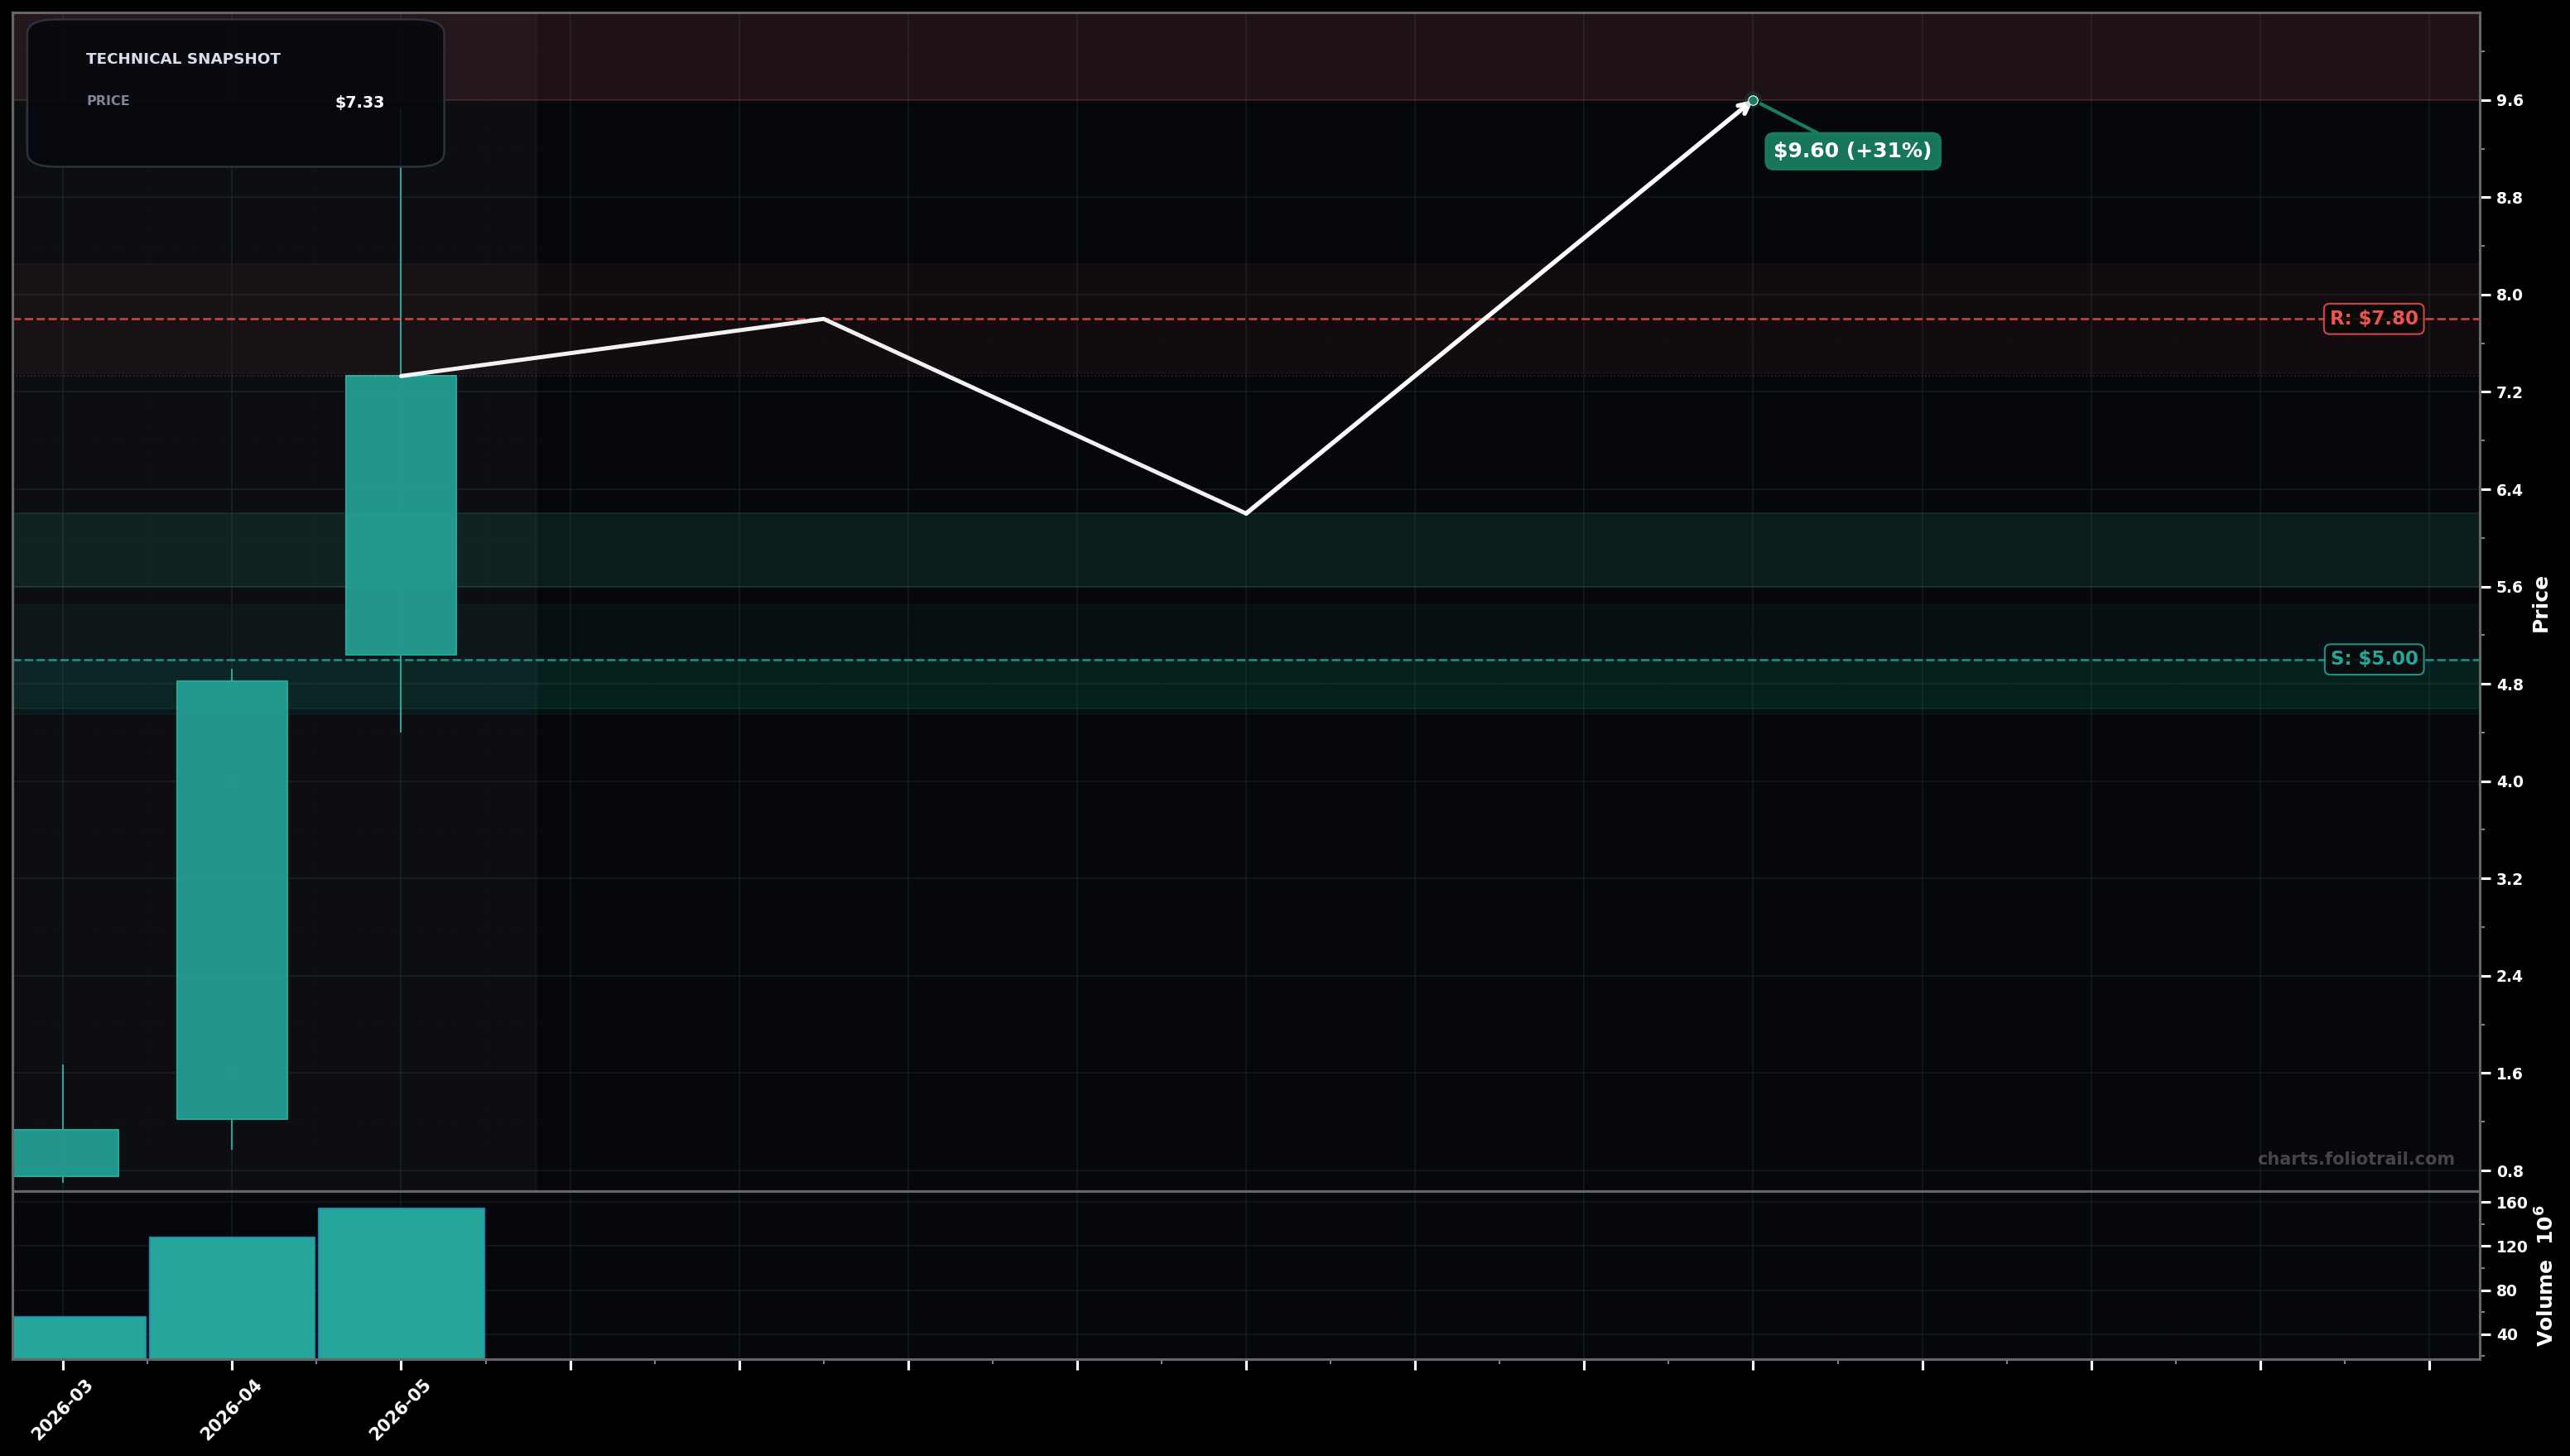
As of May 31, 2026, SIVEF (Sivers Semiconductors AB (publ)) is in a volatility expansion state on the monthly chart, with a confidence level of 72%. Key support is at $5.00 and key resistance at $7.80. Monthly has a strong impulsive push with big green candles and rising volume; latest close around $7.33 after a spike toward the $9.6 area.
Bullish continuation: price consolidates above ~$5.0–$5.5 (former breakout area), then pushes back to the prior spike zone; fits an Elliott impulse where current move is likely wave 3 with a wave 4 chop before another leg higher. Rough probability ~60%.
Bearish mean-reversion: failed continuation under ~$7.8 leads to a deeper pullback to retest the breakout base; would align with a larger wave 2 / wave 4 correction and Fibonacci retrace into the prior impulse body. Rough probability ~40%.
Monthly close above $7.80 (holds above the recent breakout zone) for 2 consecutive months
Monthly close below $5.00 (loss of the breakout base)
Use pullbacks into the prior breakout/impulse base (likely Fib retrace zone) with $5.00 as the key swing-low reference support; add more only if the retest holds on closes.
Trim into extension beyond the prior spike high ($9.6) where volatility is elevated and upside becomes increasingly parabolic/overextended; scale out more as price moves further into blue-sky extension.
As of May 31, 2026, SIVEF (Sivers Semiconductors AB (publ)) is in a volatility expansion state on the monthly chart with 72% confidence. Monthly has a strong impulsive push with big green candles and rising volume; latest close around $7.33 after a spike toward the $9.6 area.
On the monthly timeframe, SIVEF has key support at $5.00 and key resistance at $7.80. The most likely scenario (bullish) targets $7.80 and $9.60, with a revert level at $6.20.
SIVEF (Sivers Semiconductors AB (publ)) is currently classified as volatility expansion on the monthly chart, with 72% confidence. Confirmation requires: Monthly close above $7.80 (holds above the recent breakout zone) for 2 consecutive months This would be invalidated by: Monthly close below $5.00 (loss of the breakout base)
The most likely scenario (bullish) targets $7.80 and $9.60, with a revert level at $6.20. The alternative scenario (bearish) targets $6.20 and $5.00.
Multi-layer AI agents analyse 200+ stocks across daily, weekly, and monthly timeframes — producing market state classifications, price scenarios with targets, and position entry/exit levels. Daily charts updated every trading day at 6 PM ET. Weekly charts refresh Fridays. Monthly charts refresh on the last trading day of each month. No paywall. No sign-up required.
Built by Foliotrail.
All content on this website — including charts, analysis, price targets, support/resistance levels, and position zones — is generated entirely by AI and provided for educational and informational purposes only.
This is not financial advice. NEXUSNOIR VENTURES SL (the operator of this website) is not a registered investment adviser or broker-dealer. You should not make investment decisions based solely on this information. Always do your own research and consult a qualified financial advisor.
By continuing, you acknowledge that you have read and agree to our full disclaimer & terms of use and privacy policy.