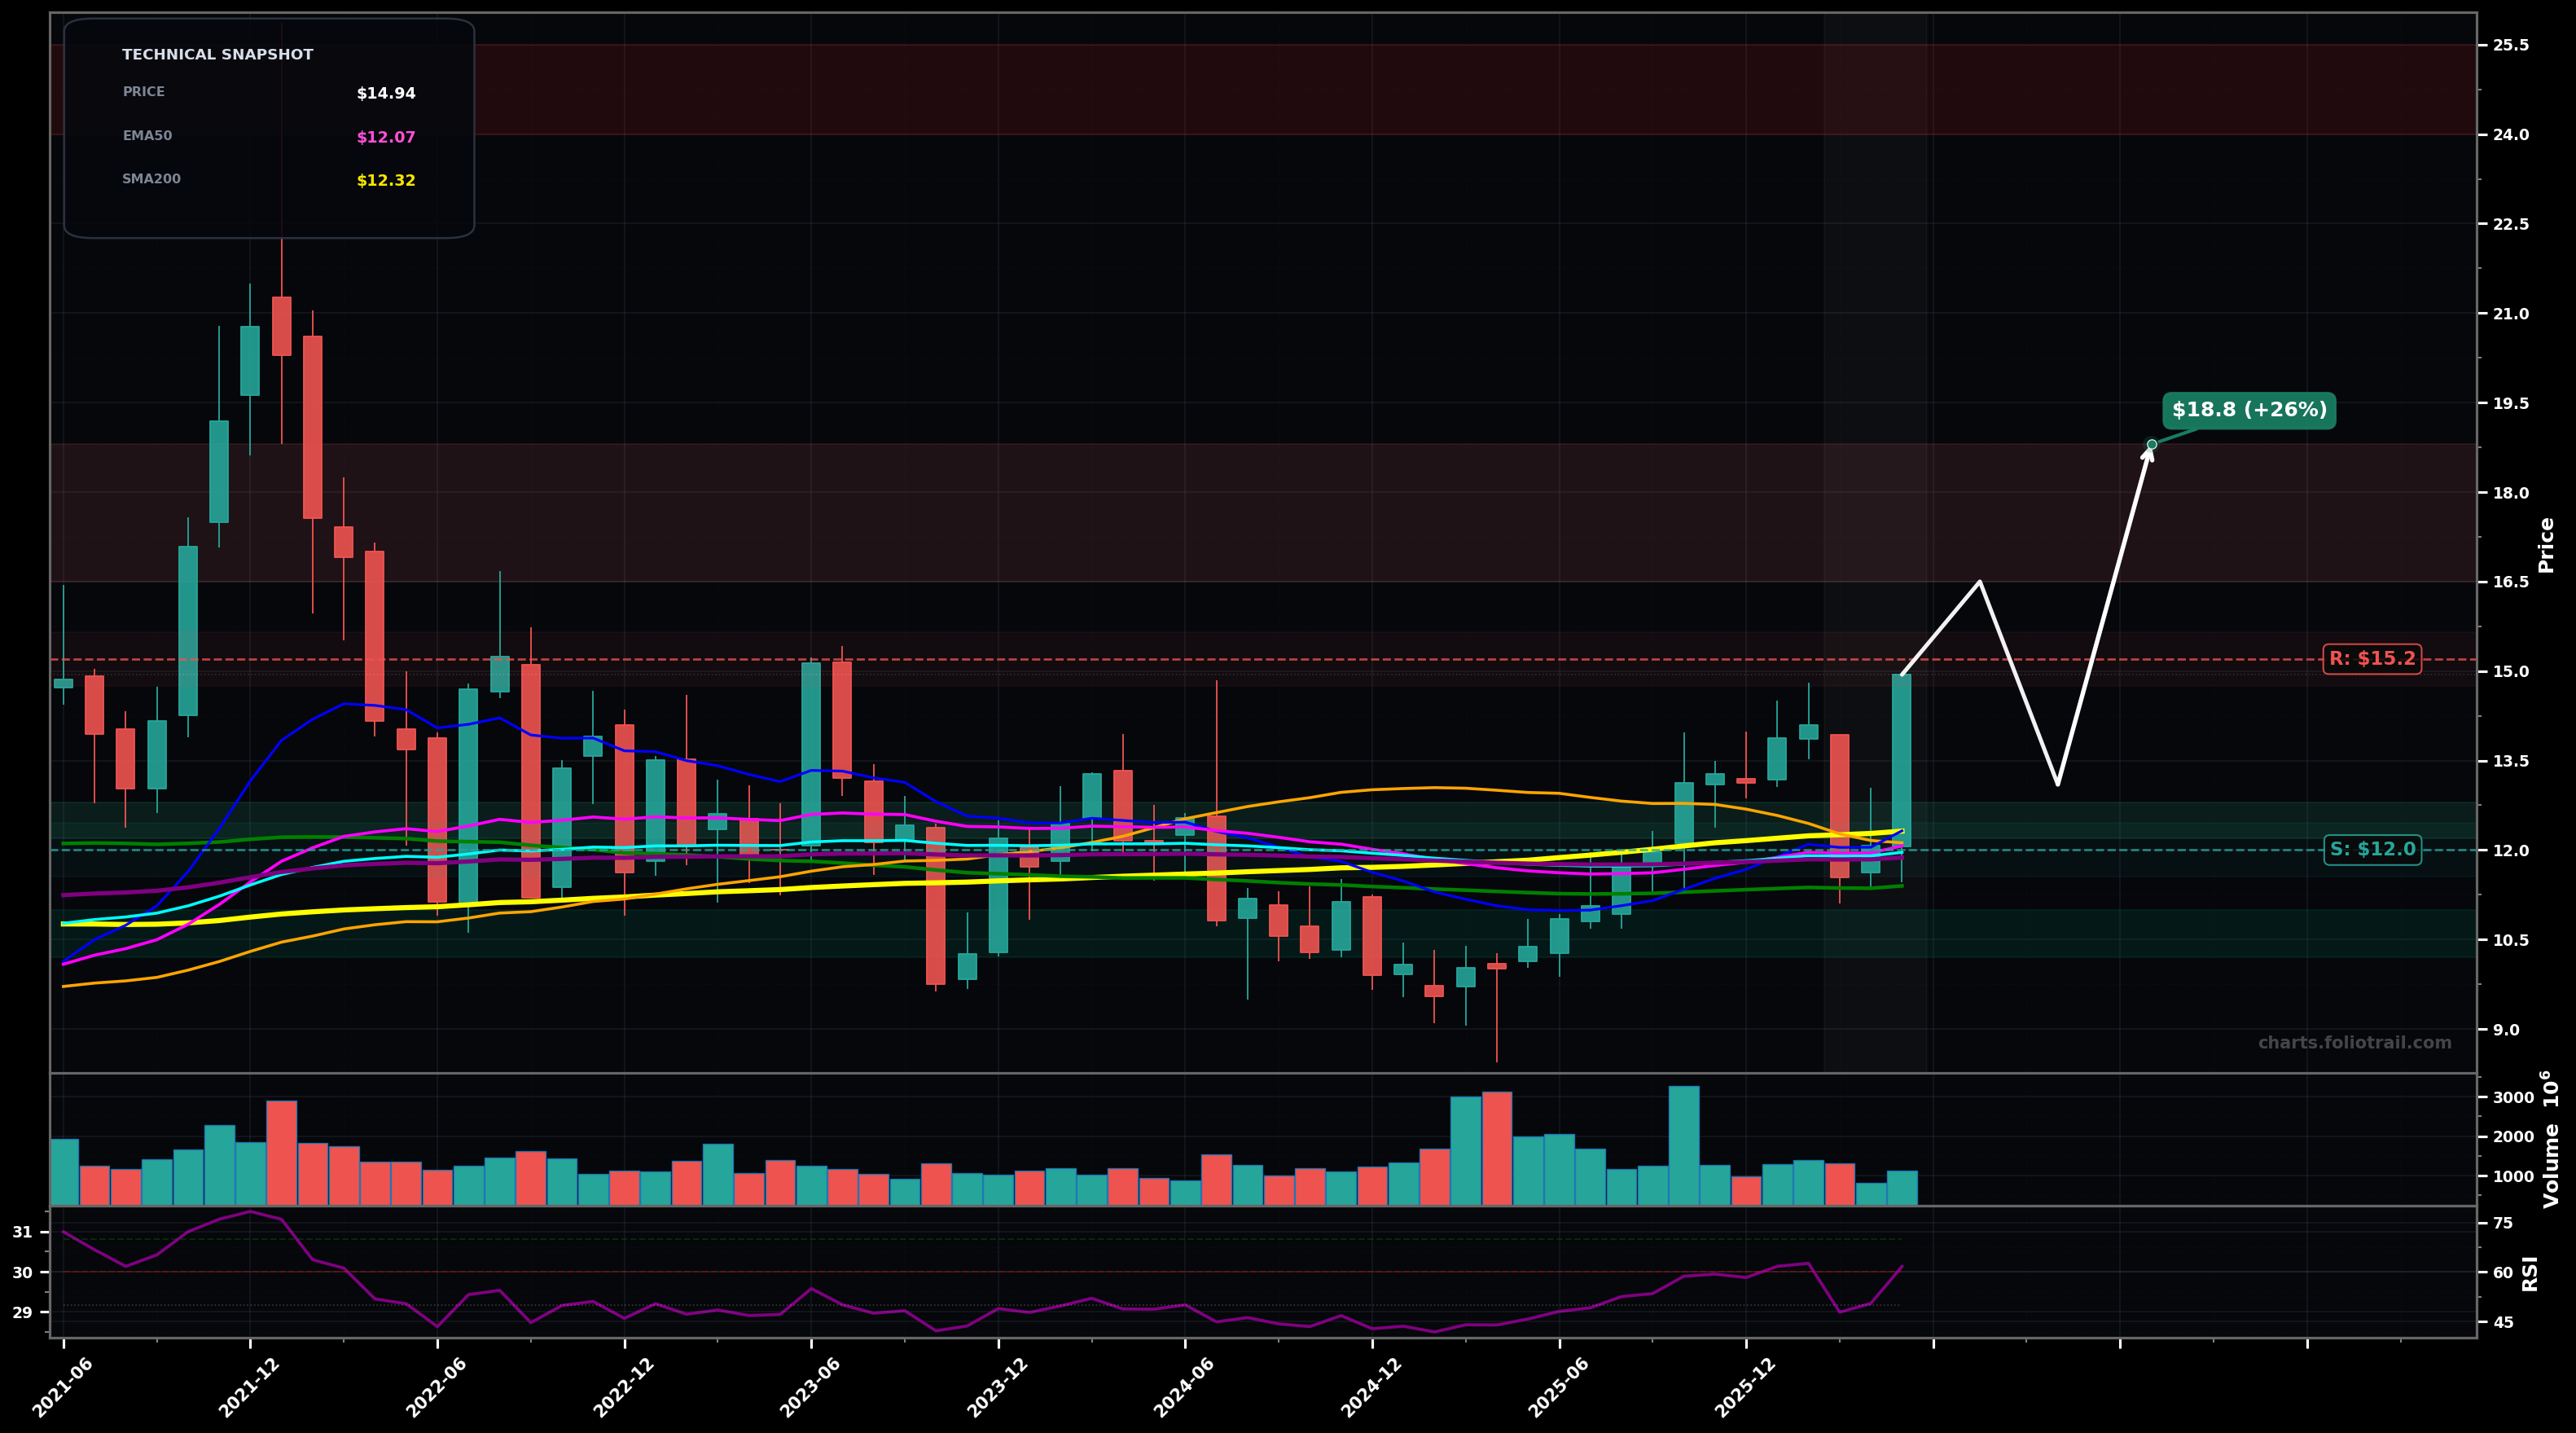
As of May 22, 2026, F (Ford Motor Company) is in a breakout reversal state on the monthly chart, with a confidence level of 67%. Key support is at $12.0 and key resistance at $15.2. Monthly breakout impulse: price at ~$14.94 with a strong green candle lifting above the full MA cluster (~$11.9–$12.3) on improved momentum (RSI ~61.7).
Bullish continuation: pullback/retest holds $12 area (prior range top + MA cluster), then price pushes to clear $15.2 and grinds toward the next supply zone; Elliott view: likely starting an impulsive Wave 3 up out of a multi-year Wave 2/base, with $12 as the key Wave-2 hold.
Failed breakout: price rejects near $15–$15.2 and mean-reverts into the prior range; Elliott view: this becomes a Wave B pop within a larger corrective structure, leading to a Wave C/flush back toward the base.
Monthly close above $15.20
Monthly close back below $12.00
Use the reclaimed MA cluster as a demand zone: starter on shallow retest, add on deeper retest to ~$12 support, heavy add only if a full range reversion tests prior swing-low area ($10–$11).
Trim into overhead supply from prior peaks and likely Fib extensions: first at initial breakout extension, more into major resistance/extension zones, and fully exit if price reaches extreme multi-year stretch near the upper historical band.
As of May 22, 2026, F (Ford Motor Company) is in a breakout reversal state on the monthly chart with 67% confidence. Monthly breakout impulse: price at ~$14.94 with a strong green candle lifting above the full MA cluster (~$11.9–$12.3) on improved momentum (RSI ~61.7).
On the monthly timeframe, F has key support at $12.0 and key resistance at $15.2. The most likely scenario (bullish) targets $16.5 and $18.8, with a revert level at $13.1.
F (Ford Motor Company) is currently classified as breakout reversal on the monthly chart, with 67% confidence. Confirmation requires: Monthly close above $15.20 This would be invalidated by: Monthly close back below $12.00
The most likely scenario (bullish) targets $16.5 and $18.8, with a revert level at $13.1. The alternative scenario (bearish) targets $12.0 and $10.4.
Multi-layer AI agents analyse 200+ stocks across daily, weekly, and monthly timeframes — producing market state classifications, price scenarios with targets, and position entry/exit levels. Daily charts updated every trading day at 6 PM ET. Weekly charts refresh Fridays. Monthly charts refresh on the last trading day of each month. No paywall. No sign-up required.
Built by Foliotrail.
All content on this website — including charts, analysis, price targets, support/resistance levels, and position zones — is generated entirely by AI and provided for educational and informational purposes only.
This is not financial advice. NEXUSNOIR VENTURES SL (the operator of this website) is not a registered investment adviser or broker-dealer. You should not make investment decisions based solely on this information. Always do your own research and consult a qualified financial advisor.
By continuing, you acknowledge that you have read and agree to our full disclaimer & terms of use and privacy policy.