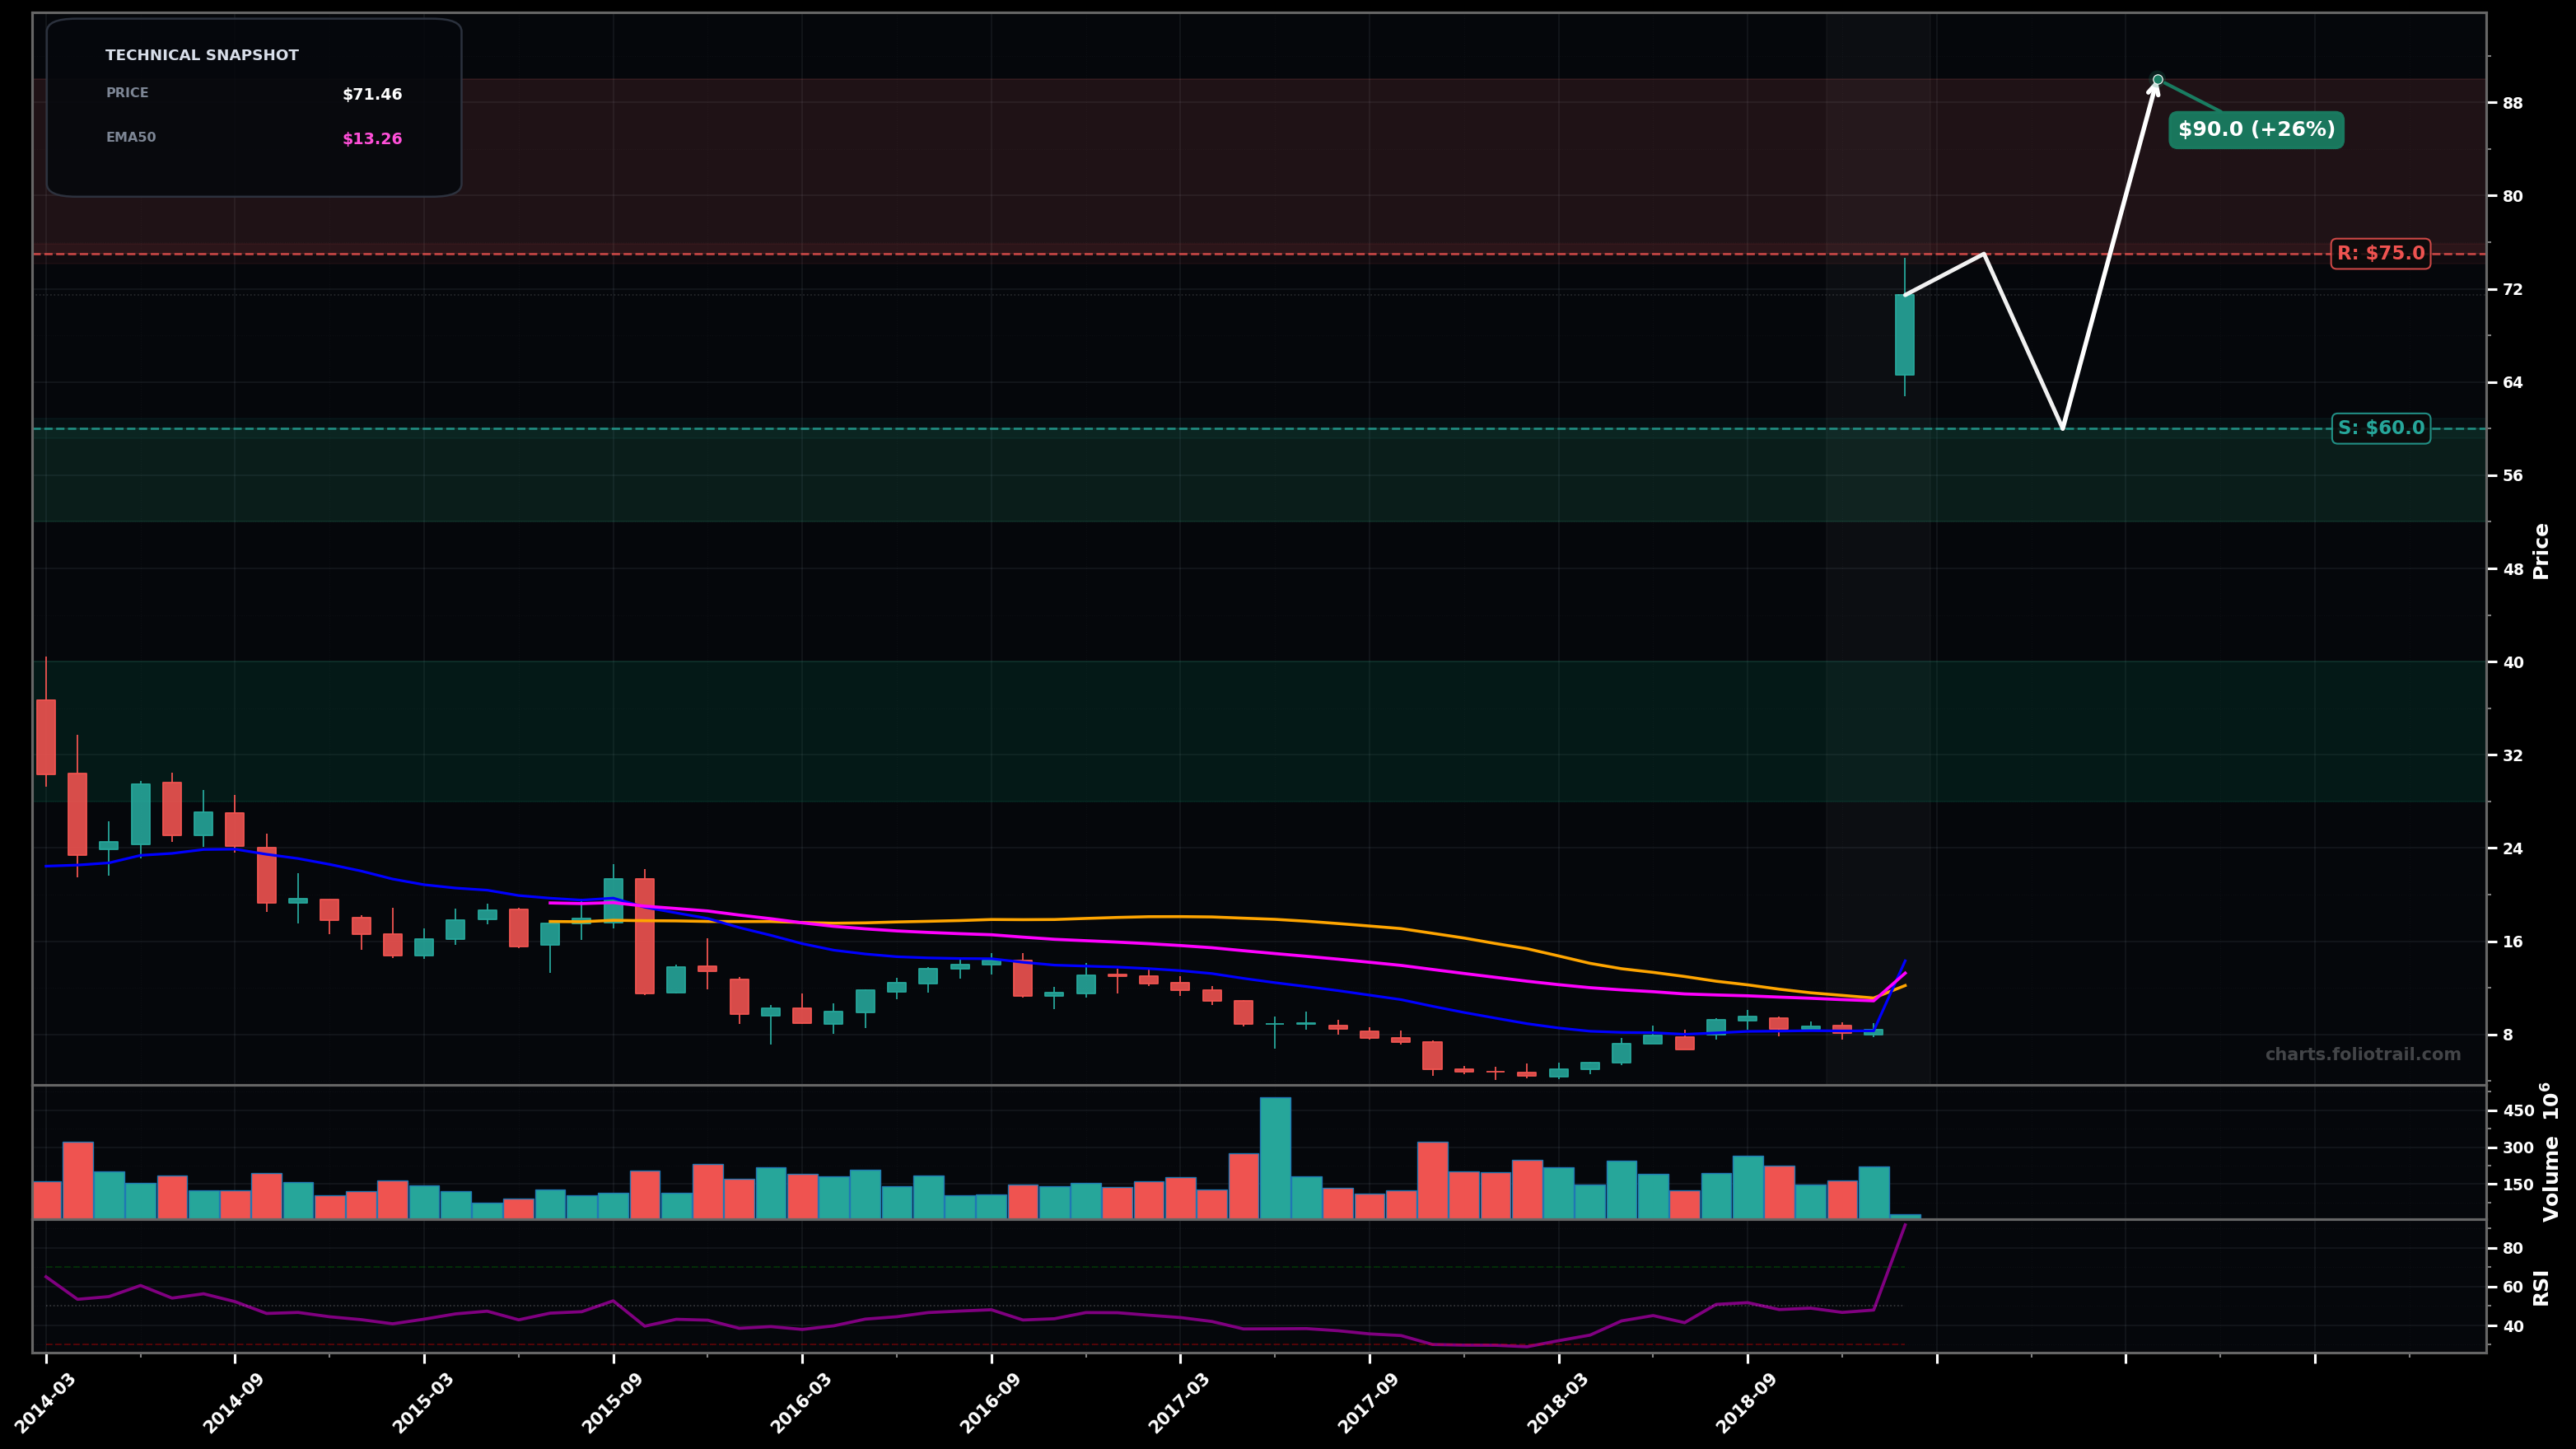
As of April 30, 2026, P (Everpure Inc.) is in a parabolic state on the monthly chart, with a confidence level of 72%. Key support is at $60.0 and key resistance at $75.0. Massive gap-like monthly breakout candle to ~$71.46 after a long base; price is extremely extended vs short MAs with RSI ~$91.8 (blow-off risk).
Momentum cool-off: price consolidates above the breakout area (post-parabolic digestion), then attempts a secondary push; Elliott view: likely Wave 3 peak in, entering Wave 4 sideways/complex; Fib focus is holding above the ~38.2% retrace of the spike.
Mean-reversion: sharper pullback to retest the pre-breakout structure and MA cluster; Elliott view: Wave 4 becomes deeper (toward 50–61.8% of the spike) before any larger Wave 5 attempt; risk elevated if a large red close near lows appears on monthly.
2 monthly closes holding above ~$60
Monthly close back below ~$45
Buy zones mapped to likely Fib retrace of the spike (38.2/50/61.8%) + prior breakout shelf; heavy add only if a deeper Wave-4 style retrace/base forms.
With RSI extreme and price far above EMA/SMA cluster, trim into vertical extensions (probable Wave-5/terminal behavior) and fully exit if price enters a euphoric overshoot zone.
As of April 30, 2026, P (Everpure Inc.) is in a parabolic state on the monthly chart with 72% confidence. Massive gap-like monthly breakout candle to ~$71.46 after a long base; price is extremely extended vs short MAs with RSI ~$91.8 (blow-off risk).
On the monthly timeframe, P has key support at $60.0 and key resistance at $75.0. The most likely scenario (bullish) targets $75.0 and $90.0, with a revert level at $60.0.
P (Everpure Inc.) is currently classified as parabolic on the monthly chart, with 72% confidence. Confirmation requires: 2 monthly closes holding above ~$60 This would be invalidated by: Monthly close back below ~$45
The most likely scenario (bullish) targets $75.0 and $90.0, with a revert level at $60.0. The alternative scenario (bearish) targets $52.0 and $40.0.
Multi-layer AI agents analyse 200+ stocks across daily, weekly, and monthly timeframes — producing market state classifications, price scenarios with targets, and position entry/exit levels. Daily charts updated every trading day at 6 PM ET. Weekly charts refresh Fridays. Monthly charts refresh on the last trading day of each month. No paywall. No sign-up required.
Built by Foliotrail.
All content on this website — including charts, analysis, price targets, support/resistance levels, and position zones — is generated entirely by AI and provided for educational and informational purposes only.
This is not financial advice. NEXUSNOIR VENTURES SL (the operator of this website) is not a registered investment adviser or broker-dealer. You should not make investment decisions based solely on this information. Always do your own research and consult a qualified financial advisor.
By continuing, you acknowledge that you have read and agree to our full disclaimer & terms of use and privacy policy.