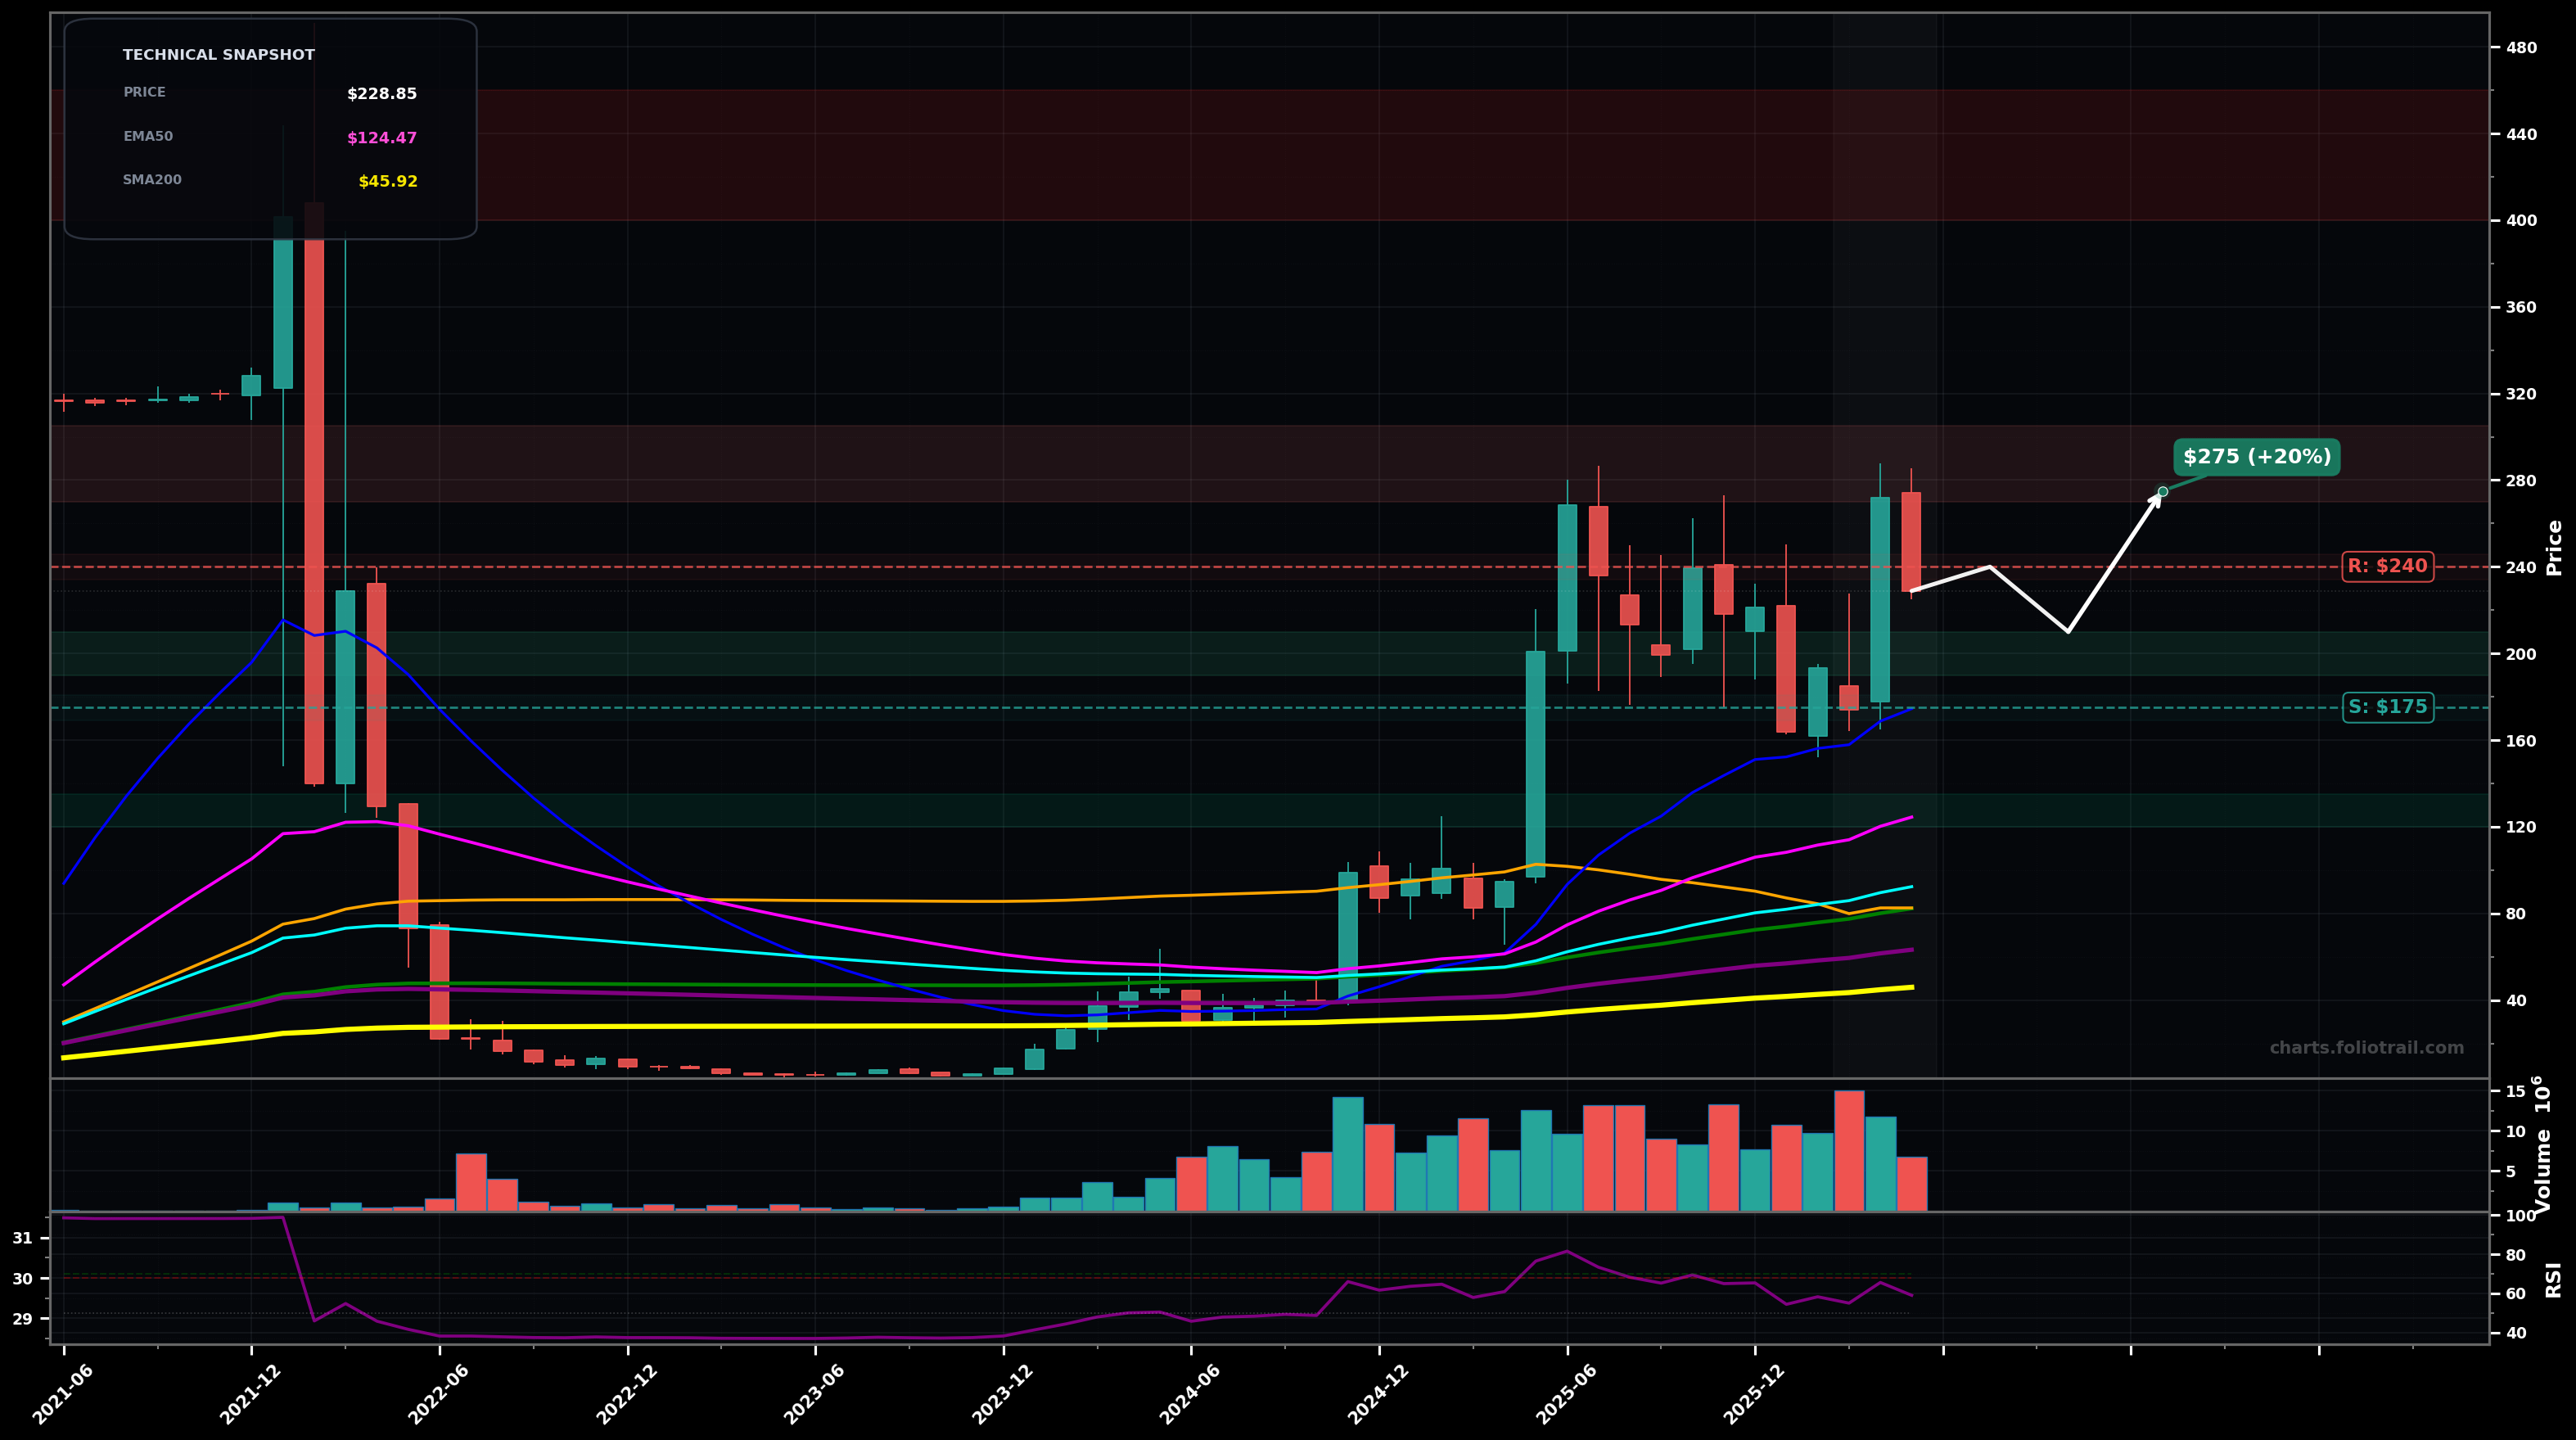
As of May 22, 2026, DAVE (Dave Inc.) is in a uptrend state on the monthly chart, with a confidence level of 64%. Key support is at $175 and key resistance at $240. Monthly up-move remains intact but last candles show a pullback/consolidation after a spike to the $270s; price still well above rising EMA50 ($124) and EMA100 ($92).
Range resolves up after a brief digestion: buyers defend $200–$210 area, then reclaim $240 and retest the prior supply zone around the $270s; if momentum returns, extension toward low-$300s becomes plausible.
Deeper monthly pullback: failure to hold $200 leads to a drop toward the prior breakout/volume shelf around $175; if that breaks, price mean-reverts toward the rising EMA50 zone (trend still potentially intact but much weaker).
Monthly close back above $240 (followed by another close holding above $240) would confirm continuation.
Monthly close below $175 would invalidate the current HH/HL structure and shift risk toward a larger down leg.
Start near the post-spike consolidation base ($190–$210), add at the swing-low reference/structure support (~$175), heavy add only on a full mean-reversion to rising EMA50/major trend support (~$125).
Trim into prior monthly supply/extension zones (recent highs ~$270s then potential fib/psych extensions), and fully close only if price becomes extremely stretched vs EMA50/100 with blow-off characteristics into $400+.
As of May 22, 2026, DAVE (Dave Inc.) is in a uptrend state on the monthly chart with 64% confidence. Monthly up-move remains intact but last candles show a pullback/consolidation after a spike to the $270s; price still well above rising EMA50 ($124) and EMA100 ($92).
On the monthly timeframe, DAVE has key support at $175 and key resistance at $240. The most likely scenario (bullish) targets $240 and $275, with a revert level at $210.
DAVE (Dave Inc.) is currently classified as uptrend on the monthly chart, with 64% confidence. Confirmation requires: Monthly close back above $240 (followed by another close holding above $240) would confirm continuation. This would be invalidated by: Monthly close below $175 would invalidate the current HH/HL structure and shift risk toward a larger down leg.
The most likely scenario (bullish) targets $240 and $275, with a revert level at $210. The alternative scenario (bearish) targets $175 and $125.
Multi-layer AI agents analyse 200+ stocks across daily, weekly, and monthly timeframes — producing market state classifications, price scenarios with targets, and position entry/exit levels. Daily charts updated every trading day at 6 PM ET. Weekly charts refresh Fridays. Monthly charts refresh on the last trading day of each month. No paywall. No sign-up required.
Built by Foliotrail.
All content on this website — including charts, analysis, price targets, support/resistance levels, and position zones — is generated entirely by AI and provided for educational and informational purposes only.
This is not financial advice. NEXUSNOIR VENTURES SL (the operator of this website) is not a registered investment adviser or broker-dealer. You should not make investment decisions based solely on this information. Always do your own research and consult a qualified financial advisor.
By continuing, you acknowledge that you have read and agree to our full disclaimer & terms of use and privacy policy.