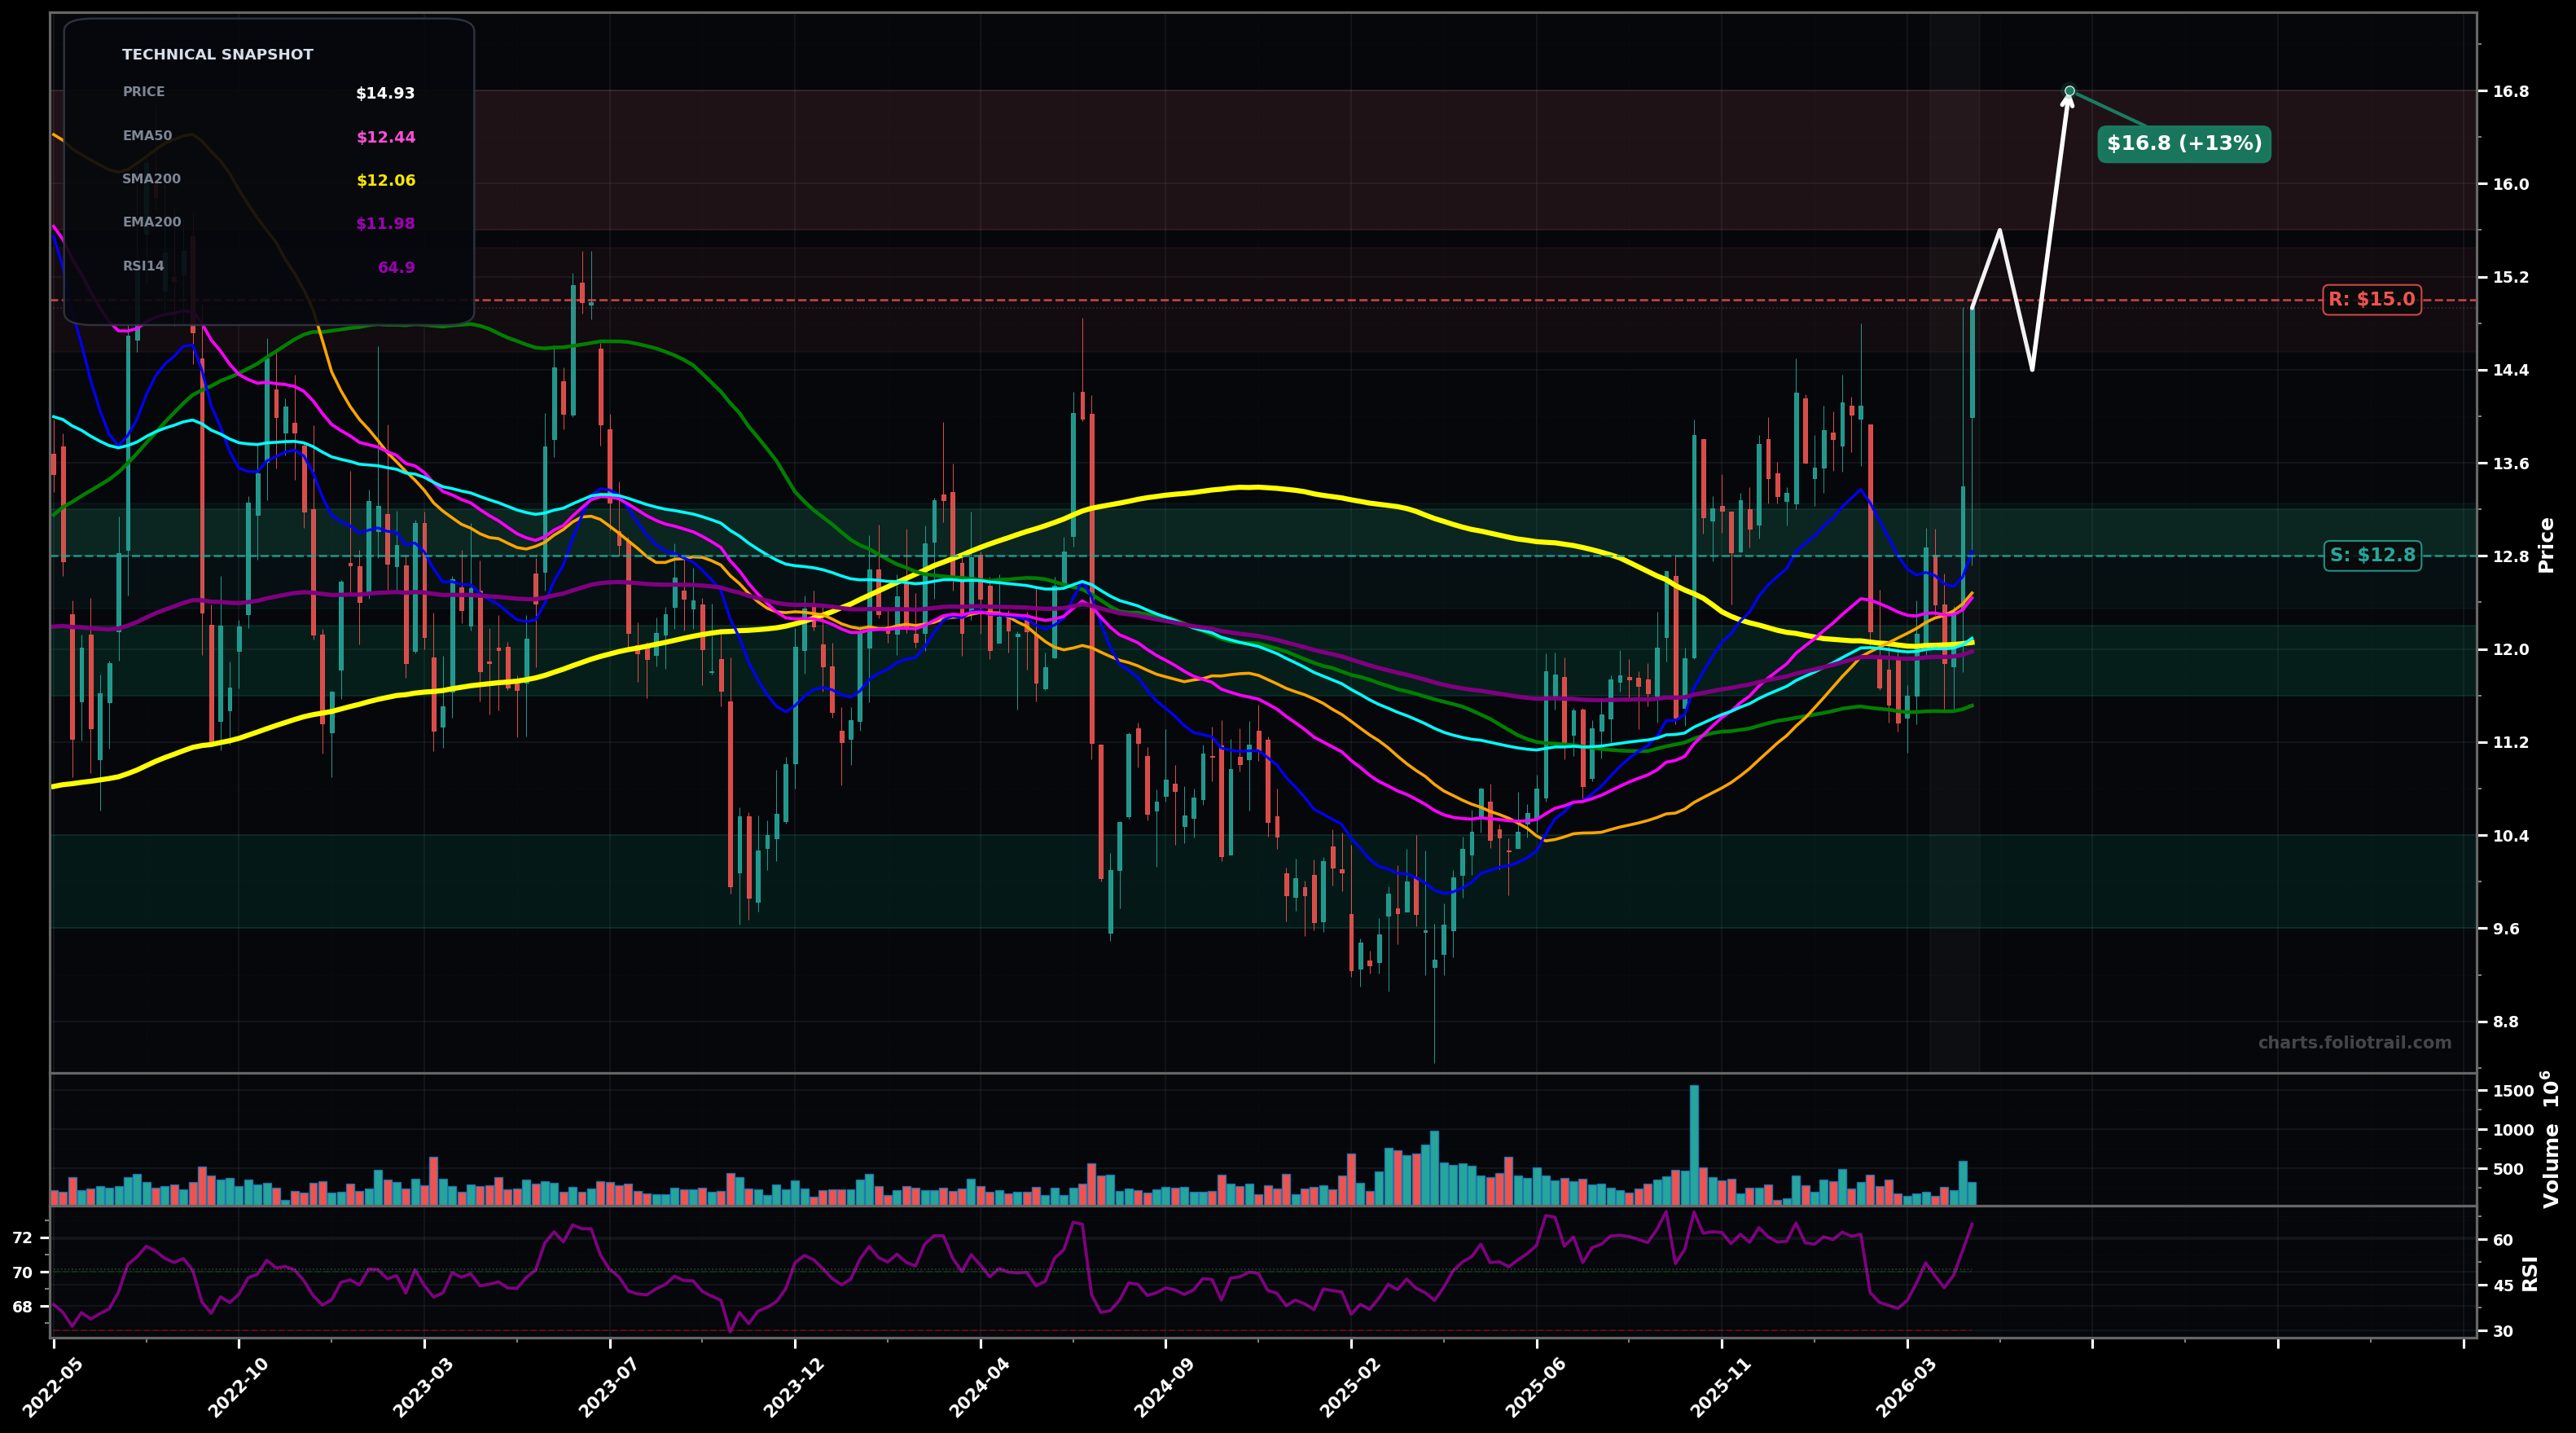
As of May 22, 2026, F (Ford Motor Company) is in a volatility expansion state on the weekly chart, with a confidence level of 66%. Key support is at $12.8 and key resistance at $15.0. Weekly strong bullish impulse to ~$14.93, clearing the prior range/highs and pushing well above the clustered MAs; momentum (RSI ~65) back in bullish zone.
Bullish continuation: breakout holds above the prior supply zone (~$14.4-$15.0), then a push to the next Fibonacci extension area; Elliott view: likely Wave 3 extension after a Wave 2 pullback into the MA cluster.
Bearish pullback/retest: breakout fades and price mean-reverts into the MA cluster (EMA200/SMA50/EMA100 area) before attempting another leg up; Elliott view: Wave 4-style consolidation after the sharp impulse.
Weekly close holding above ~$14.40 for 2 consecutive weeks
Weekly close back below ~$12.80
Buy-the-dip zones align with prior breakout/retest (~$13), the dense MA support cluster (~$12), and the major swing low demand area (~$9-$10).
Trim into Fibonacci extension/previous multi-year supply zones as price stretches far above the key MAs; higher bands imply lower forward 1-4y risk/reward.
As of May 22, 2026, F (Ford Motor Company) is in a volatility expansion state on the weekly chart with 66% confidence. Weekly strong bullish impulse to ~$14.93, clearing the prior range/highs and pushing well above the clustered MAs; momentum (RSI ~65) back in bullish zone.
On the weekly timeframe, F has key support at $12.8 and key resistance at $15.0. The most likely scenario (bullish) targets $15.6 and $16.8, with a revert level at $14.4.
F (Ford Motor Company) is currently classified as volatility expansion on the weekly chart, with 66% confidence. Confirmation requires: Weekly close holding above ~$14.40 for 2 consecutive weeks This would be invalidated by: Weekly close back below ~$12.80
The most likely scenario (bullish) targets $15.6 and $16.8, with a revert level at $14.4. The alternative scenario (bearish) targets $13.2 and $12.1.
Multi-layer AI agents analyse 200+ stocks across daily, weekly, and monthly timeframes — producing market state classifications, price scenarios with targets, and position entry/exit levels. Daily charts updated every trading day at 6 PM ET. Weekly charts refresh Fridays. Monthly charts refresh on the last trading day of each month. No paywall. No sign-up required.
Built by Foliotrail.
All content on this website — including charts, analysis, price targets, support/resistance levels, and position zones — is generated entirely by AI and provided for educational and informational purposes only.
This is not financial advice. NEXUSNOIR VENTURES SL (the operator of this website) is not a registered investment adviser or broker-dealer. You should not make investment decisions based solely on this information. Always do your own research and consult a qualified financial advisor.
By continuing, you acknowledge that you have read and agree to our full disclaimer & terms of use and privacy policy.