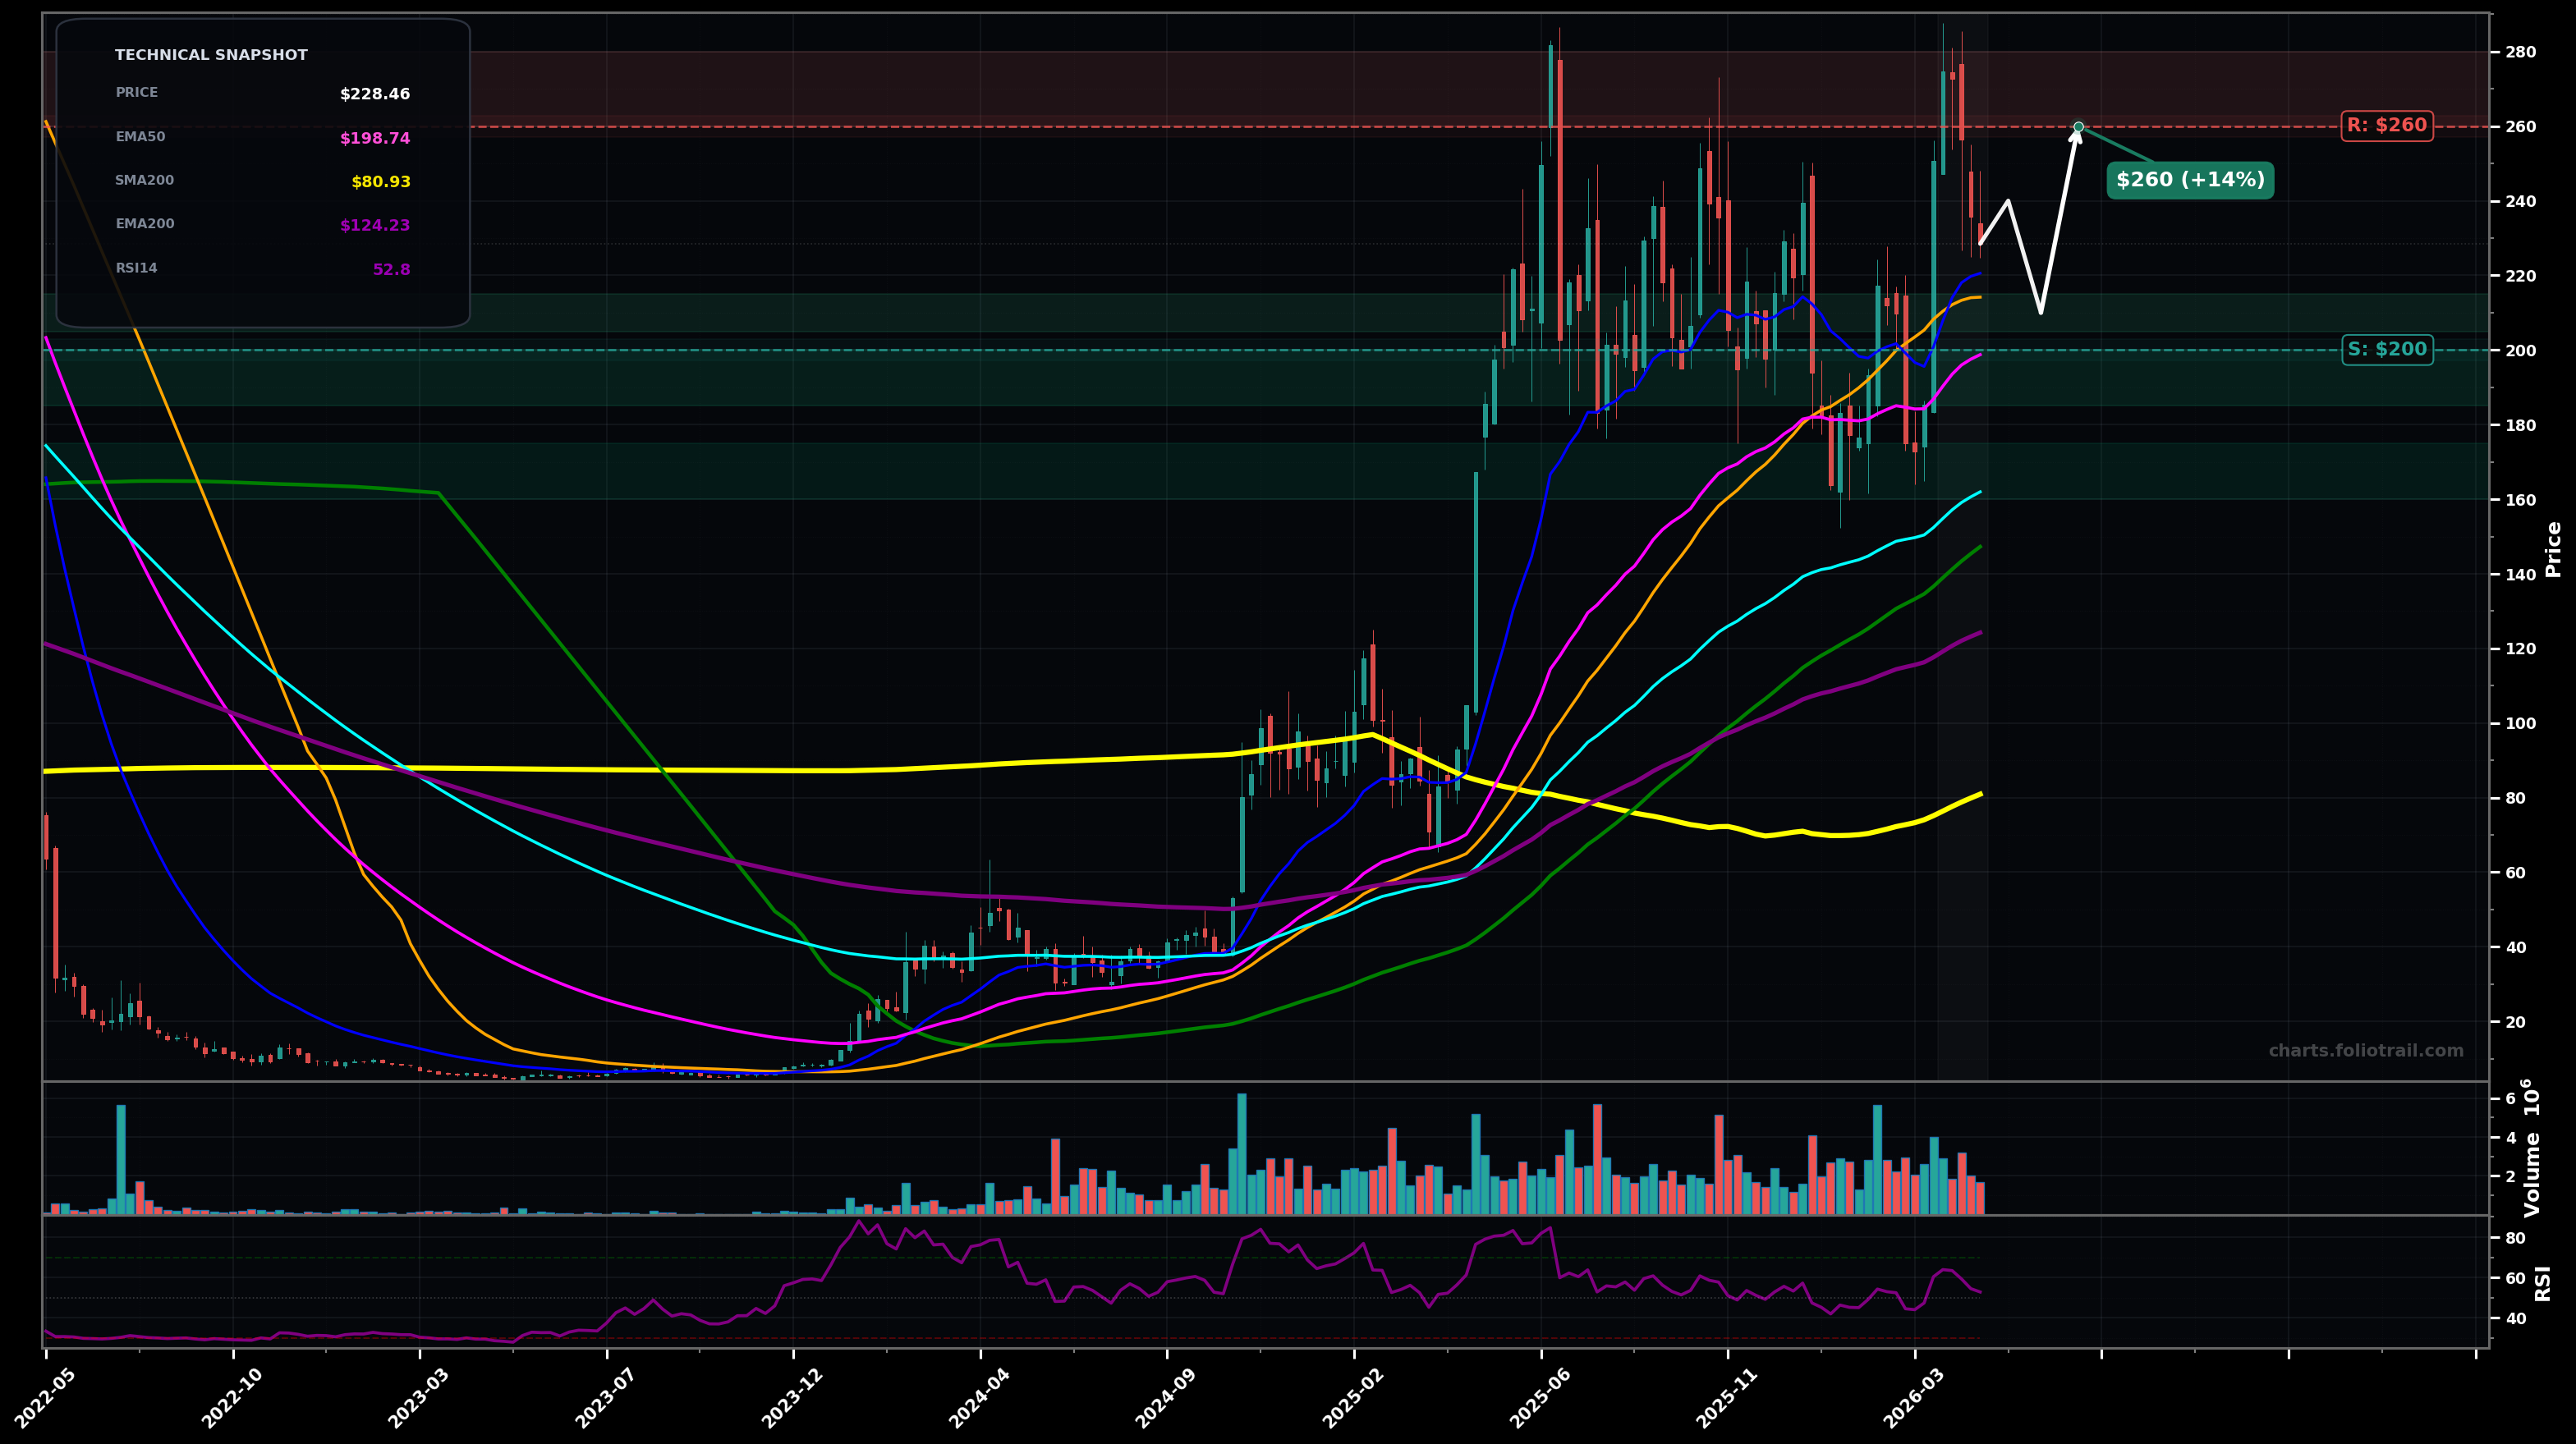
As of May 22, 2026, DAVE (Dave Inc.) is in a choppy range state on the weekly chart, with a confidence level of 62%. Key support is at $200 and key resistance at $260. Weekly pullback from the recent spike-highs; price ~$228 is still above EMA50 (~$199) and EMA100 (~$162) but below the prior supply zone near $240-$260; momentum neutral (RSI ~53).
Range continuation: holds $200-$210 support (EMA50 area), then grinds back to retest $240 and possibly the $260 supply; this fits a Wave (4) consolidation before a potential Wave (5) attempt.
Deeper correction: loses $200 (EMA50) and mean-reverts toward the next confluence zone around $180-$165 (prior structure + EMA100), consistent with a larger Wave (4) expanding/complex correction.
2 weekly closes above $260 would confirm a breakout leg from the range
Weekly close below $199 (EMA50) would invalidate the choppy-range bias and tilt to a larger pullback
Scale-in around EMA50 first; add on breakdown/retest into prior structure; heavy add near EMA100 confluence where a higher-low base is most likely to form.
Trim into the major overhead supply ($260-$280) and any extension that pushes price far above EMA50/EMA100; close if a blow-off move reaches a fib-extension style overshoot zone vs the last major swing.
As of May 22, 2026, DAVE (Dave Inc.) is in a choppy range state on the weekly chart with 62% confidence. Weekly pullback from the recent spike-highs; price ~$228 is still above EMA50 (~$199) and EMA100 (~$162) but below the prior supply zone near $240-$260; momentum neutral (RSI ~53).
On the weekly timeframe, DAVE has key support at $200 and key resistance at $260. The most likely scenario (bullish) targets $240 and $260, with a revert level at $210.
DAVE (Dave Inc.) is currently classified as choppy range on the weekly chart, with 62% confidence. Confirmation requires: 2 weekly closes above $260 would confirm a breakout leg from the range This would be invalidated by: Weekly close below $199 (EMA50) would invalidate the choppy-range bias and tilt to a larger pullback
The most likely scenario (bullish) targets $240 and $260, with a revert level at $210. The alternative scenario (bearish) targets $180 and $165.
Multi-layer AI agents analyse 200+ stocks across daily, weekly, and monthly timeframes — producing market state classifications, price scenarios with targets, and position entry/exit levels. Daily charts updated every trading day at 6 PM ET. Weekly charts refresh Fridays. Monthly charts refresh on the last trading day of each month. No paywall. No sign-up required.
Built by Foliotrail.
All content on this website — including charts, analysis, price targets, support/resistance levels, and position zones — is generated entirely by AI and provided for educational and informational purposes only.
This is not financial advice. NEXUSNOIR VENTURES SL (the operator of this website) is not a registered investment adviser or broker-dealer. You should not make investment decisions based solely on this information. Always do your own research and consult a qualified financial advisor.
By continuing, you acknowledge that you have read and agree to our full disclaimer & terms of use and privacy policy.