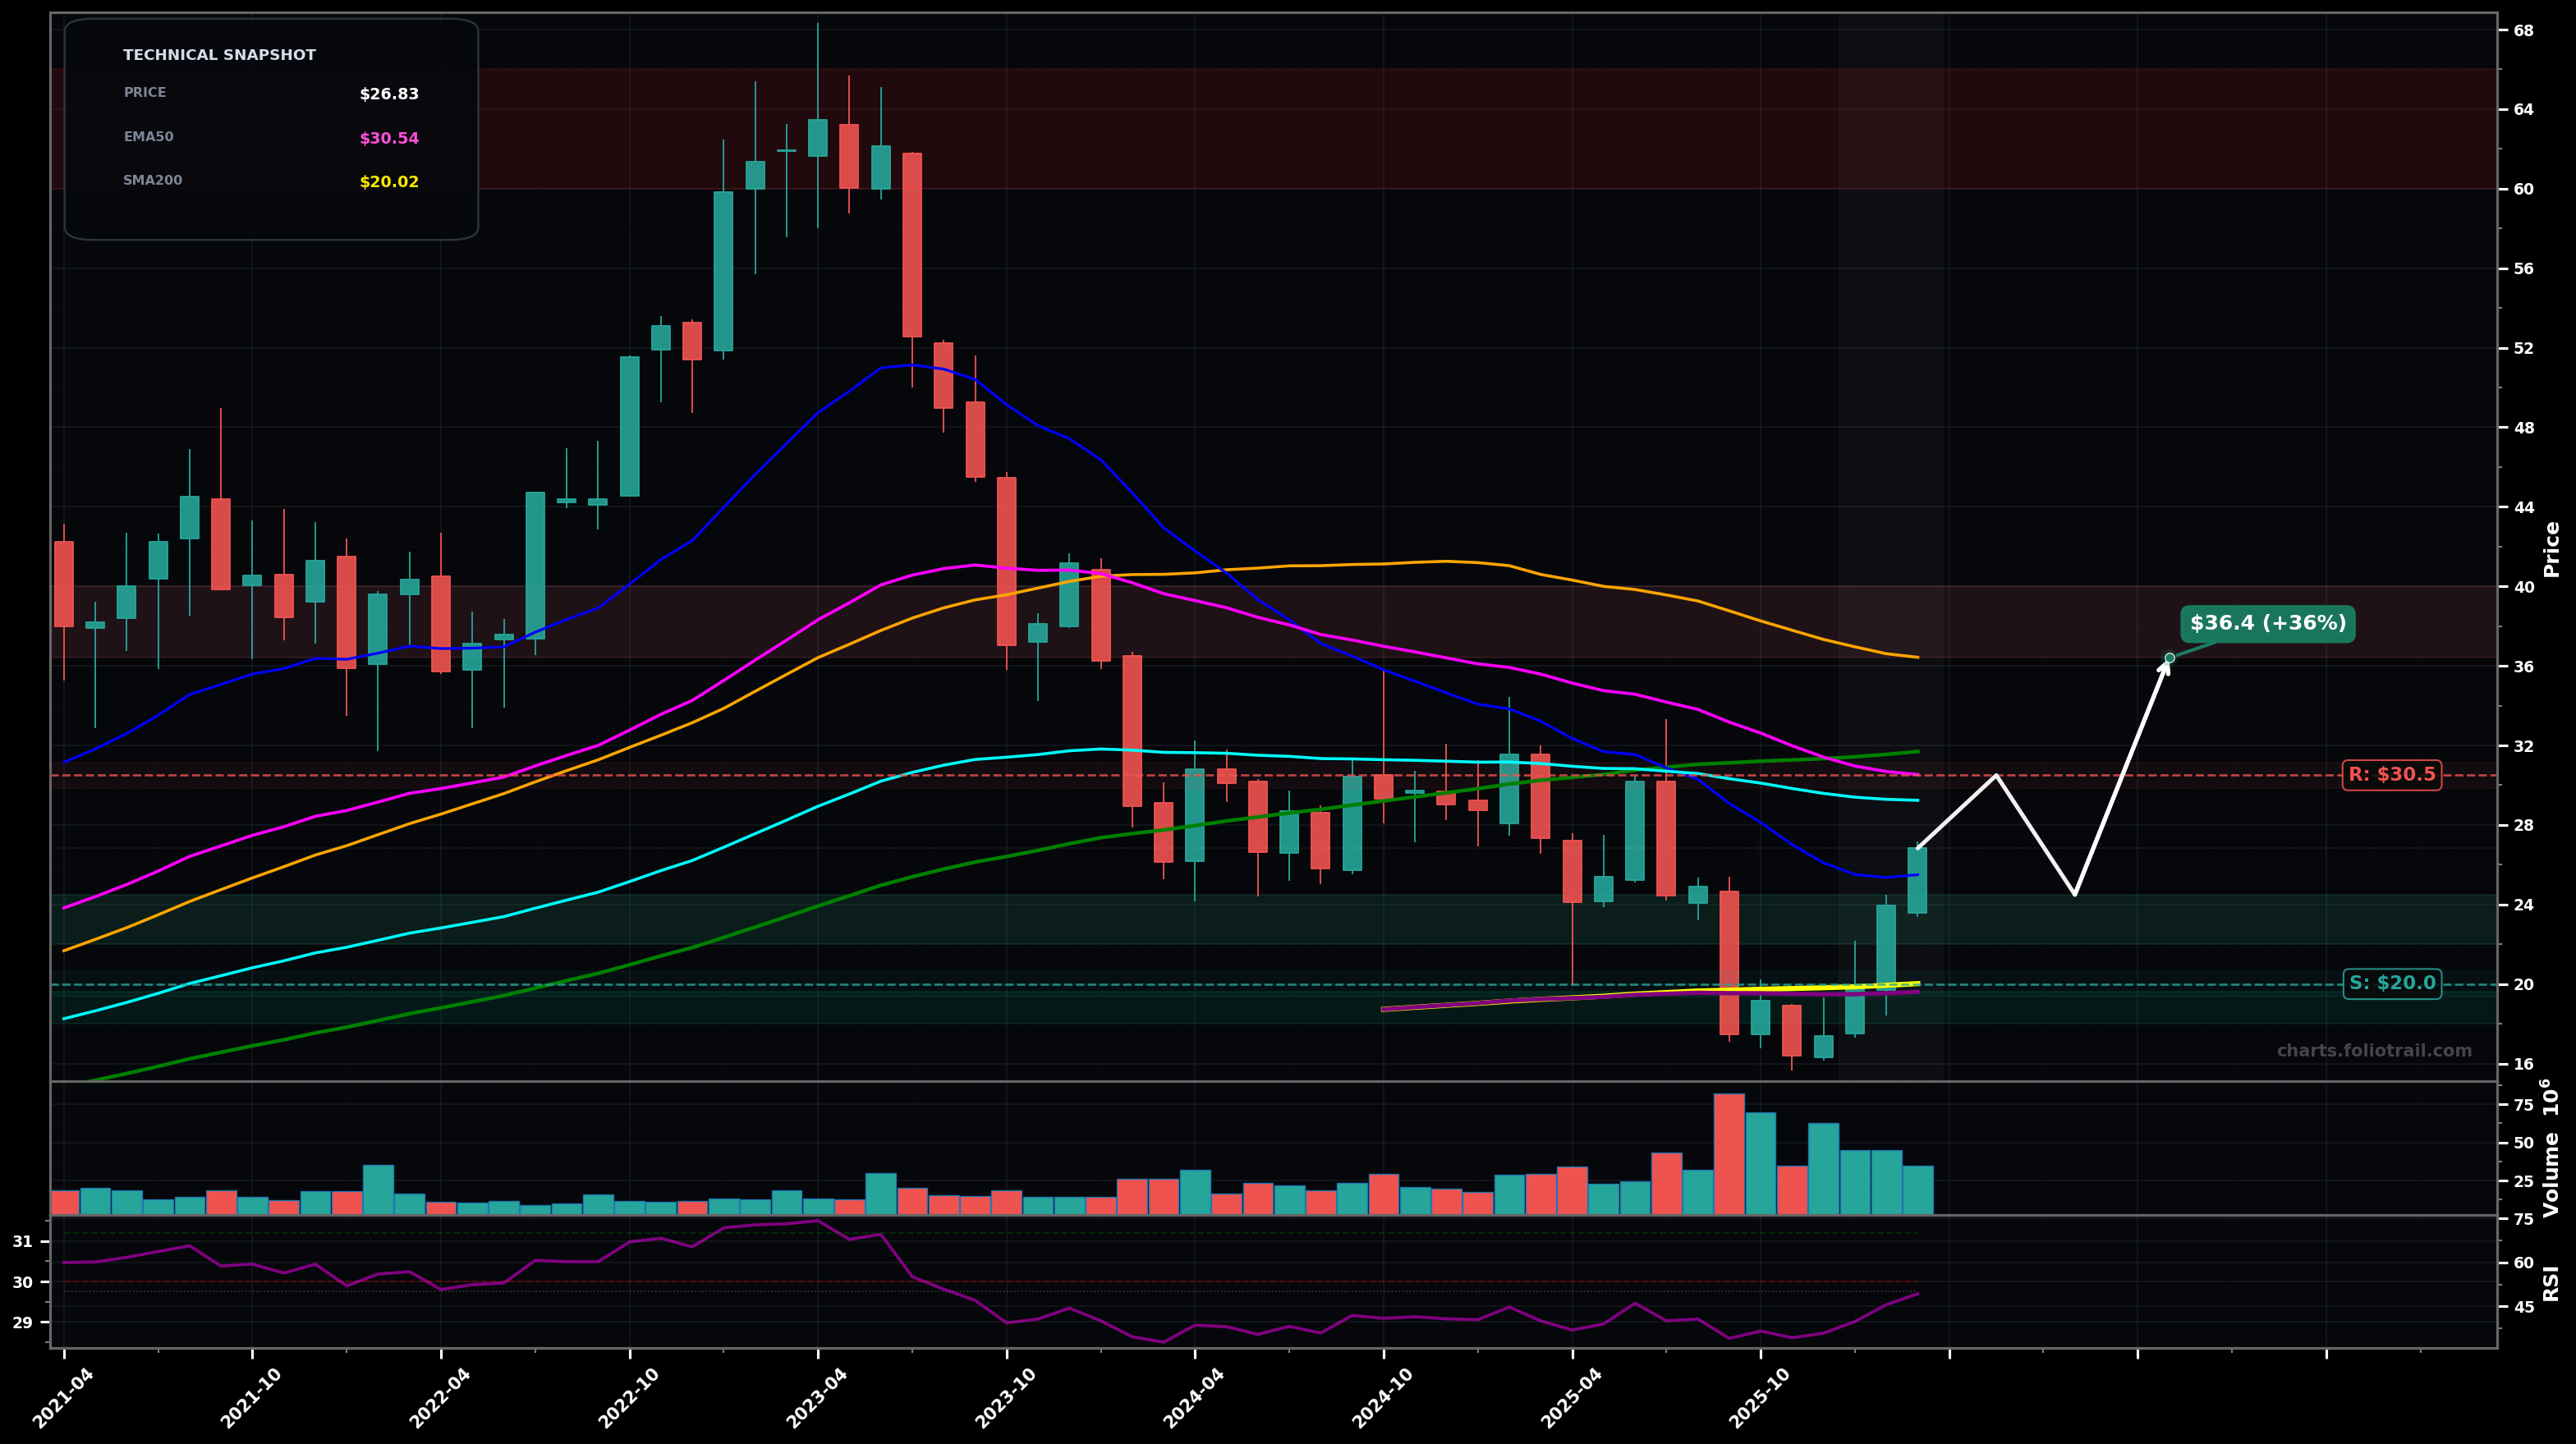
As of March 25, 2026, IRDM (Iridium Communications Inc.) is in a bottoming attempt state on the monthly chart, with a confidence level of 62%. Key support is at $20.0 and key resistance at $30.5. Monthly bounce from the ~$18–$20 base area; price ($26.83) is reclaiming short-term levels but remains below the falling EMA50/EMA100 zone (~$30–$29).
Base-building continues: price retests the breakout area/EMA20, holds a HL, then grinds up into the EMA50/EMA100 confluence and attempts a reclaim.
Bearish rejection at the EMA50/EMA100 supply zone: rally stalls near ~$29–$31, then rolls over back into the base with risk of a support break.
2+ monthly closes above $30.54 (EMA50) with a subsequent HL above $24.00
Monthly close below $19.60 (EMA200) / loss of the $20.00 area
Prefer scaling near the base floor ($20) and prior swing-low reference with EMA200 support; add more if a capitulation-style retest holds, invalidated on a sustained break below $19.60.
Trim into major moving-average overhead (SMA50 ~$36.4, then prior distribution zone ~$48–$52) and fully exit into a return toward the prior peak/upper range (~$60–$66) where mean-reversion risk is highest.
As of March 25, 2026, IRDM (Iridium Communications Inc.) is in a bottoming attempt state on the monthly chart with 62% confidence. Monthly bounce from the ~$18–$20 base area; price ($26.83) is reclaiming short-term levels but remains below the falling EMA50/EMA100 zone (~$30–$29).
On the monthly timeframe, IRDM has key support at $20.0 and key resistance at $30.5. The most likely scenario (bullish) targets $30.5 and $36.4, with a revert level at $24.5.
IRDM (Iridium Communications Inc.) is currently classified as bottoming attempt on the monthly chart, with 62% confidence. Confirmation requires: 2+ monthly closes above $30.54 (EMA50) with a subsequent HL above $24.00 This would be invalidated by: Monthly close below $19.60 (EMA200) / loss of the $20.00 area
The most likely scenario (bullish) targets $30.5 and $36.4, with a revert level at $24.5. The alternative scenario (bearish) targets $22.0 and $18.0.
Multi-layer AI agents analyse 200+ stocks across daily, weekly, and monthly timeframes — producing market state classifications, price scenarios with targets, and position entry/exit levels. Updated every trading day after market close. No paywall. No sign-up required.
Built by Foliotrail.
All content on this website — including charts, analysis, price targets, support/resistance levels, and position zones — is generated entirely by AI and provided for educational and informational purposes only.
This is not financial advice. NEXUSNOIR VENTURES SL (the operator of this website) is not a registered investment adviser or broker-dealer. You should not make investment decisions based solely on this information. Always do your own research and consult a qualified financial advisor.
By continuing, you acknowledge that you have read and agree to our full disclaimer & terms of use and privacy policy.