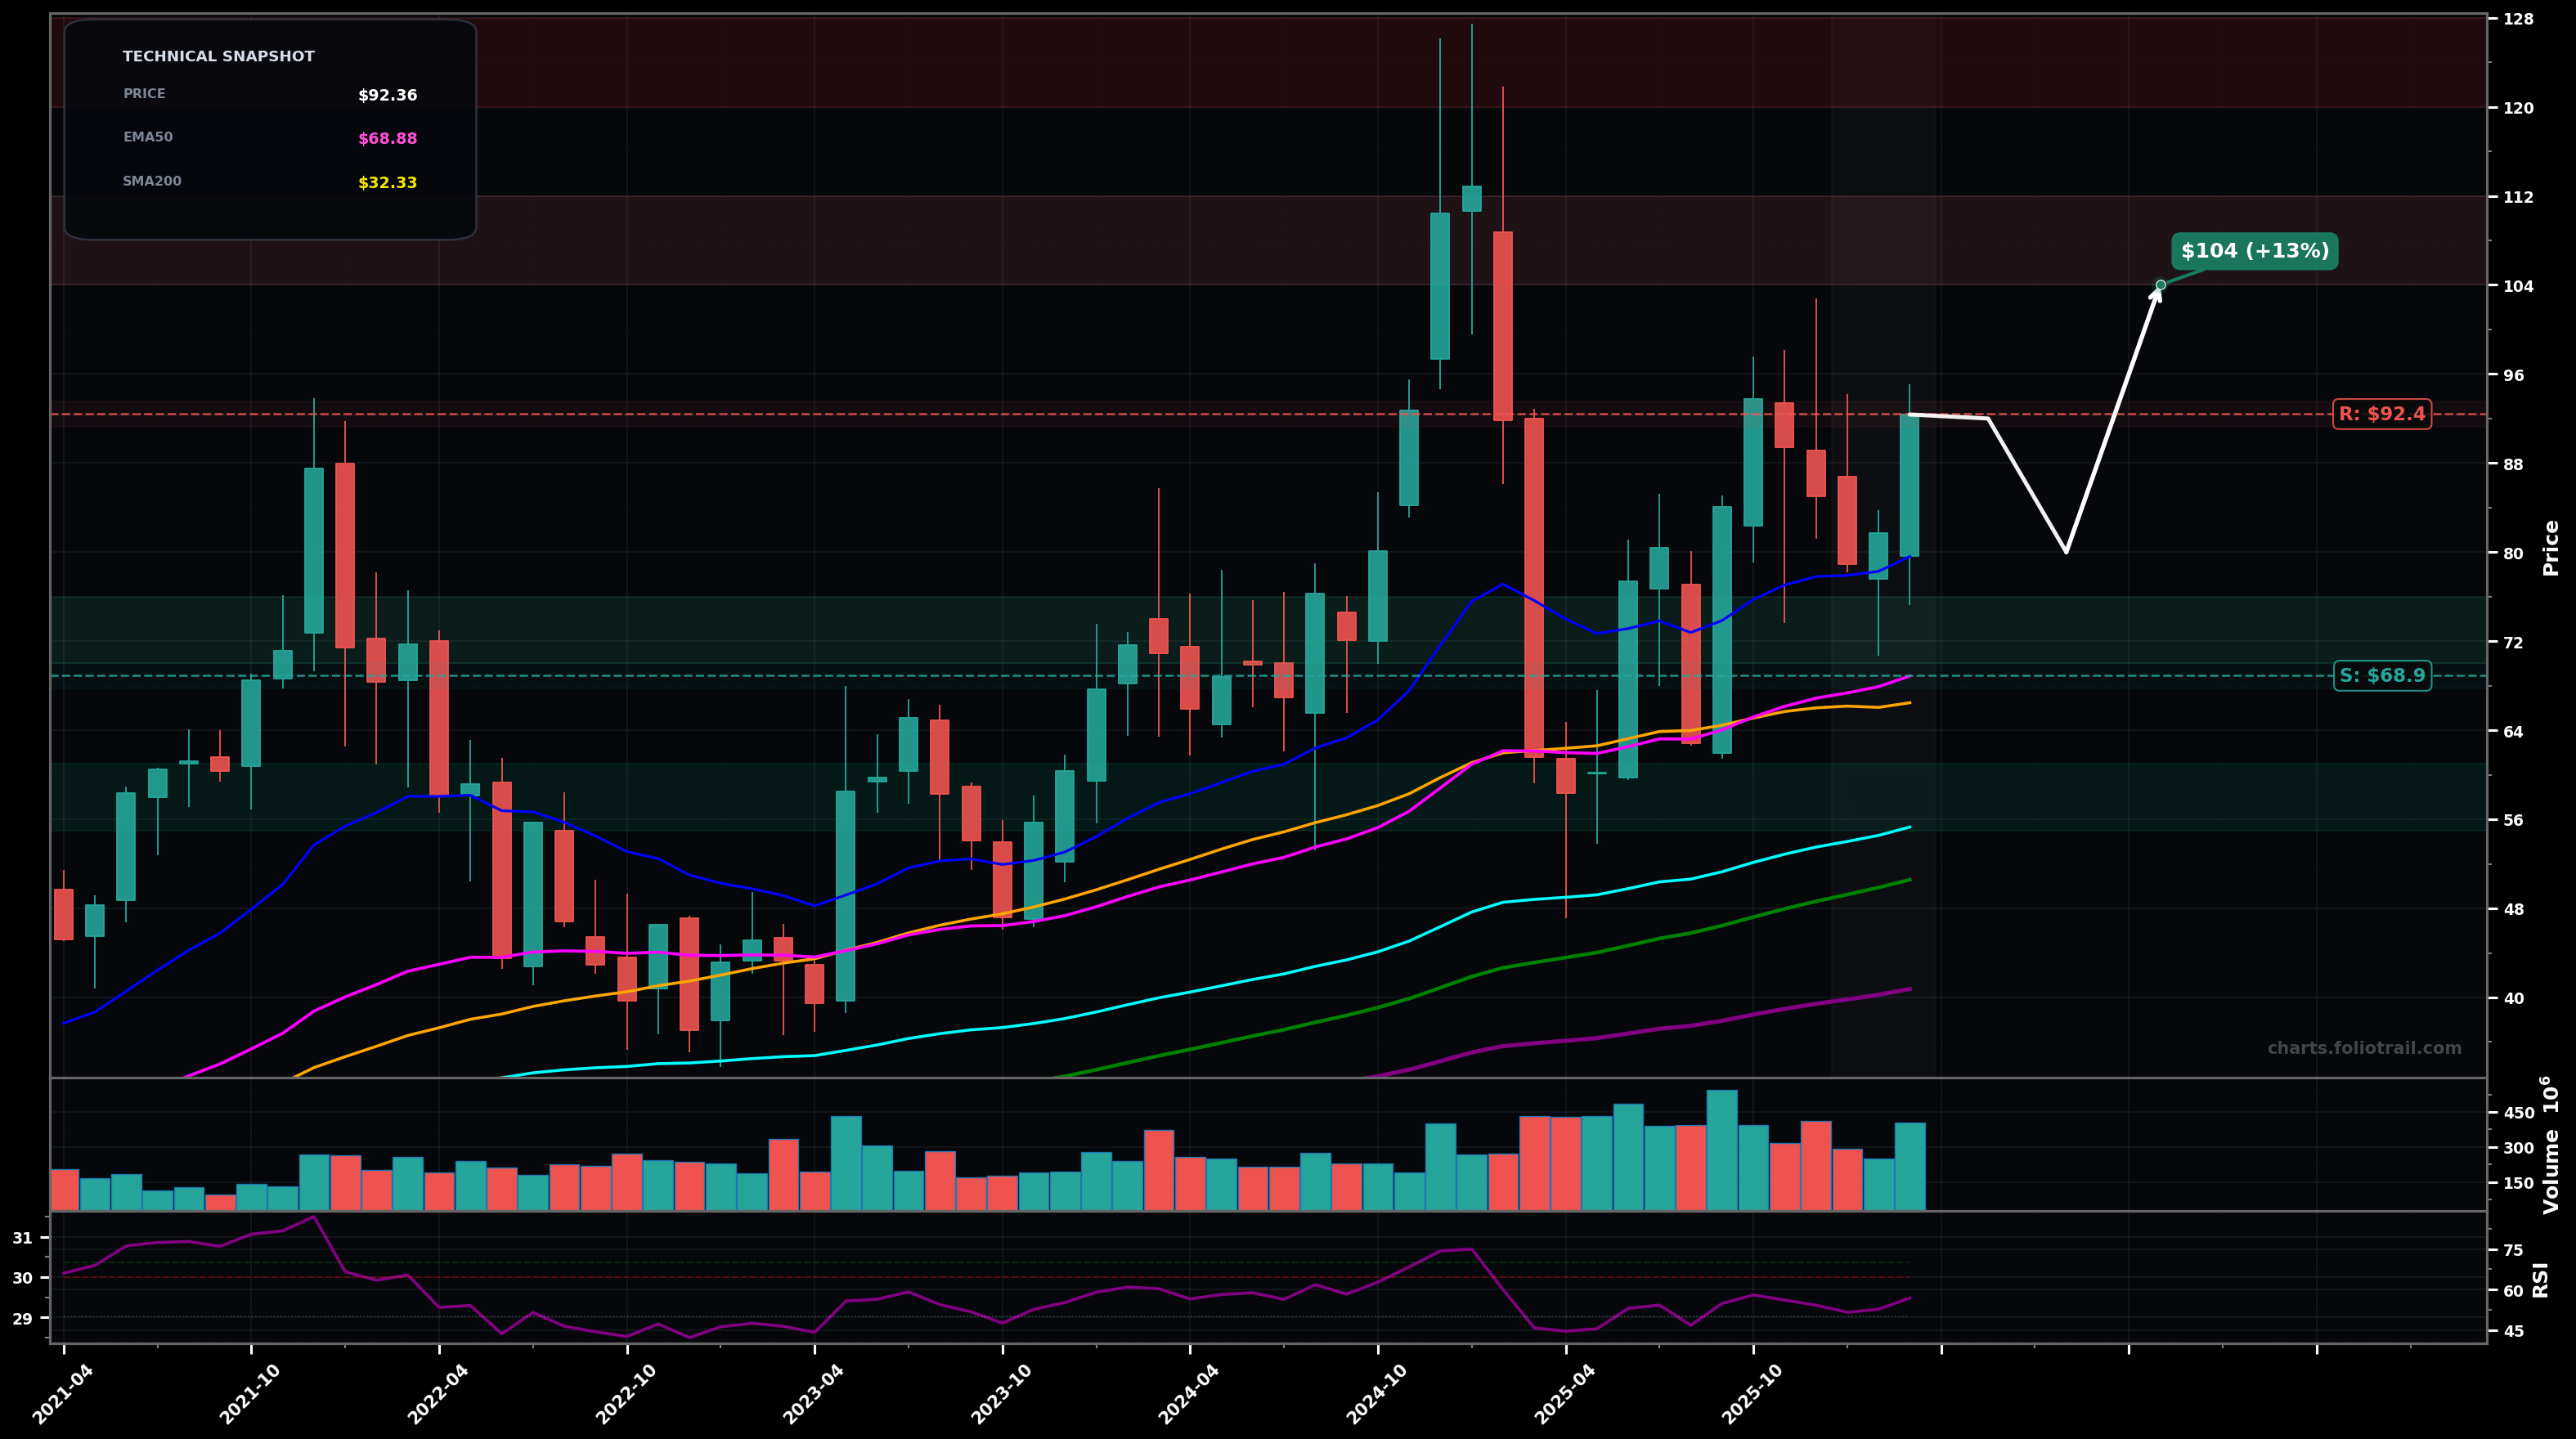
As of May 22, 2026, MRVL (Marvell Technology, Inc.) is in a parabolic state on the monthly chart, with a confidence level of 74%. Key support is at $165 and key resistance at $200. Vertical monthly breakout with 2 huge green candles into ~$196, strong volume expansion; price extremely extended above all key MAs with RSI~78 (overbought).
Parabolic continuation (likely Elliott Wave 3 extension): brief digestion/pullback toward the breakout zone, then another push higher; Fibonacci extension from the ~$100 breakout points to the low-$200s as the next magnet.
Blow-off/mean-reversion: after the vertical leg, price forms a sharp retrace toward the first real demand shelf; typical pullback candidates are the prior breakout ($165) and then the next base/MA cluster area ($120-$130) if selling accelerates.
Monthly close holds above $165 (former breakout area) on any pullback
Monthly close back below $140 (loss of breakout structure and momentum)
Start near the breakout retest ($165) for trend-following; add on deeper retrace into prior consolidation; heavy add near the next major structure/round-number demand and closer to the faster MA catch-up zone if the move mean-reverts.
Trim into upside extensions as price is already far above EMA50/100 and RSI is stretched; use Fibonacci extension/round-number supply zones for staged de-risking in case this is a late-cycle Wave 5/blow-off phase.
As of May 22, 2026, MRVL (Marvell Technology, Inc.) is in a parabolic state on the monthly chart with 74% confidence. Vertical monthly breakout with 2 huge green candles into ~$196, strong volume expansion; price extremely extended above all key MAs with RSI~78 (overbought).
On the monthly timeframe, MRVL has key support at $165 and key resistance at $200. The most likely scenario (bullish) targets $210 and $235, with a revert level at $170.
MRVL (Marvell Technology, Inc.) is currently classified as parabolic on the monthly chart, with 74% confidence. Confirmation requires: Monthly close holds above $165 (former breakout area) on any pullback This would be invalidated by: Monthly close back below $140 (loss of breakout structure and momentum)
The most likely scenario (bullish) targets $210 and $235, with a revert level at $170. The alternative scenario (bearish) targets $165 and $125.
Multi-layer AI agents analyse 200+ stocks across daily, weekly, and monthly timeframes — producing market state classifications, price scenarios with targets, and position entry/exit levels. Daily charts updated every trading day at 6 PM ET. Weekly charts refresh Fridays. Monthly charts refresh on the last trading day of each month. No paywall. No sign-up required.
Built by Foliotrail.
All content on this website — including charts, analysis, price targets, support/resistance levels, and position zones — is generated entirely by AI and provided for educational and informational purposes only.
This is not financial advice. NEXUSNOIR VENTURES SL (the operator of this website) is not a registered investment adviser or broker-dealer. You should not make investment decisions based solely on this information. Always do your own research and consult a qualified financial advisor.
By continuing, you acknowledge that you have read and agree to our full disclaimer & terms of use and privacy policy.