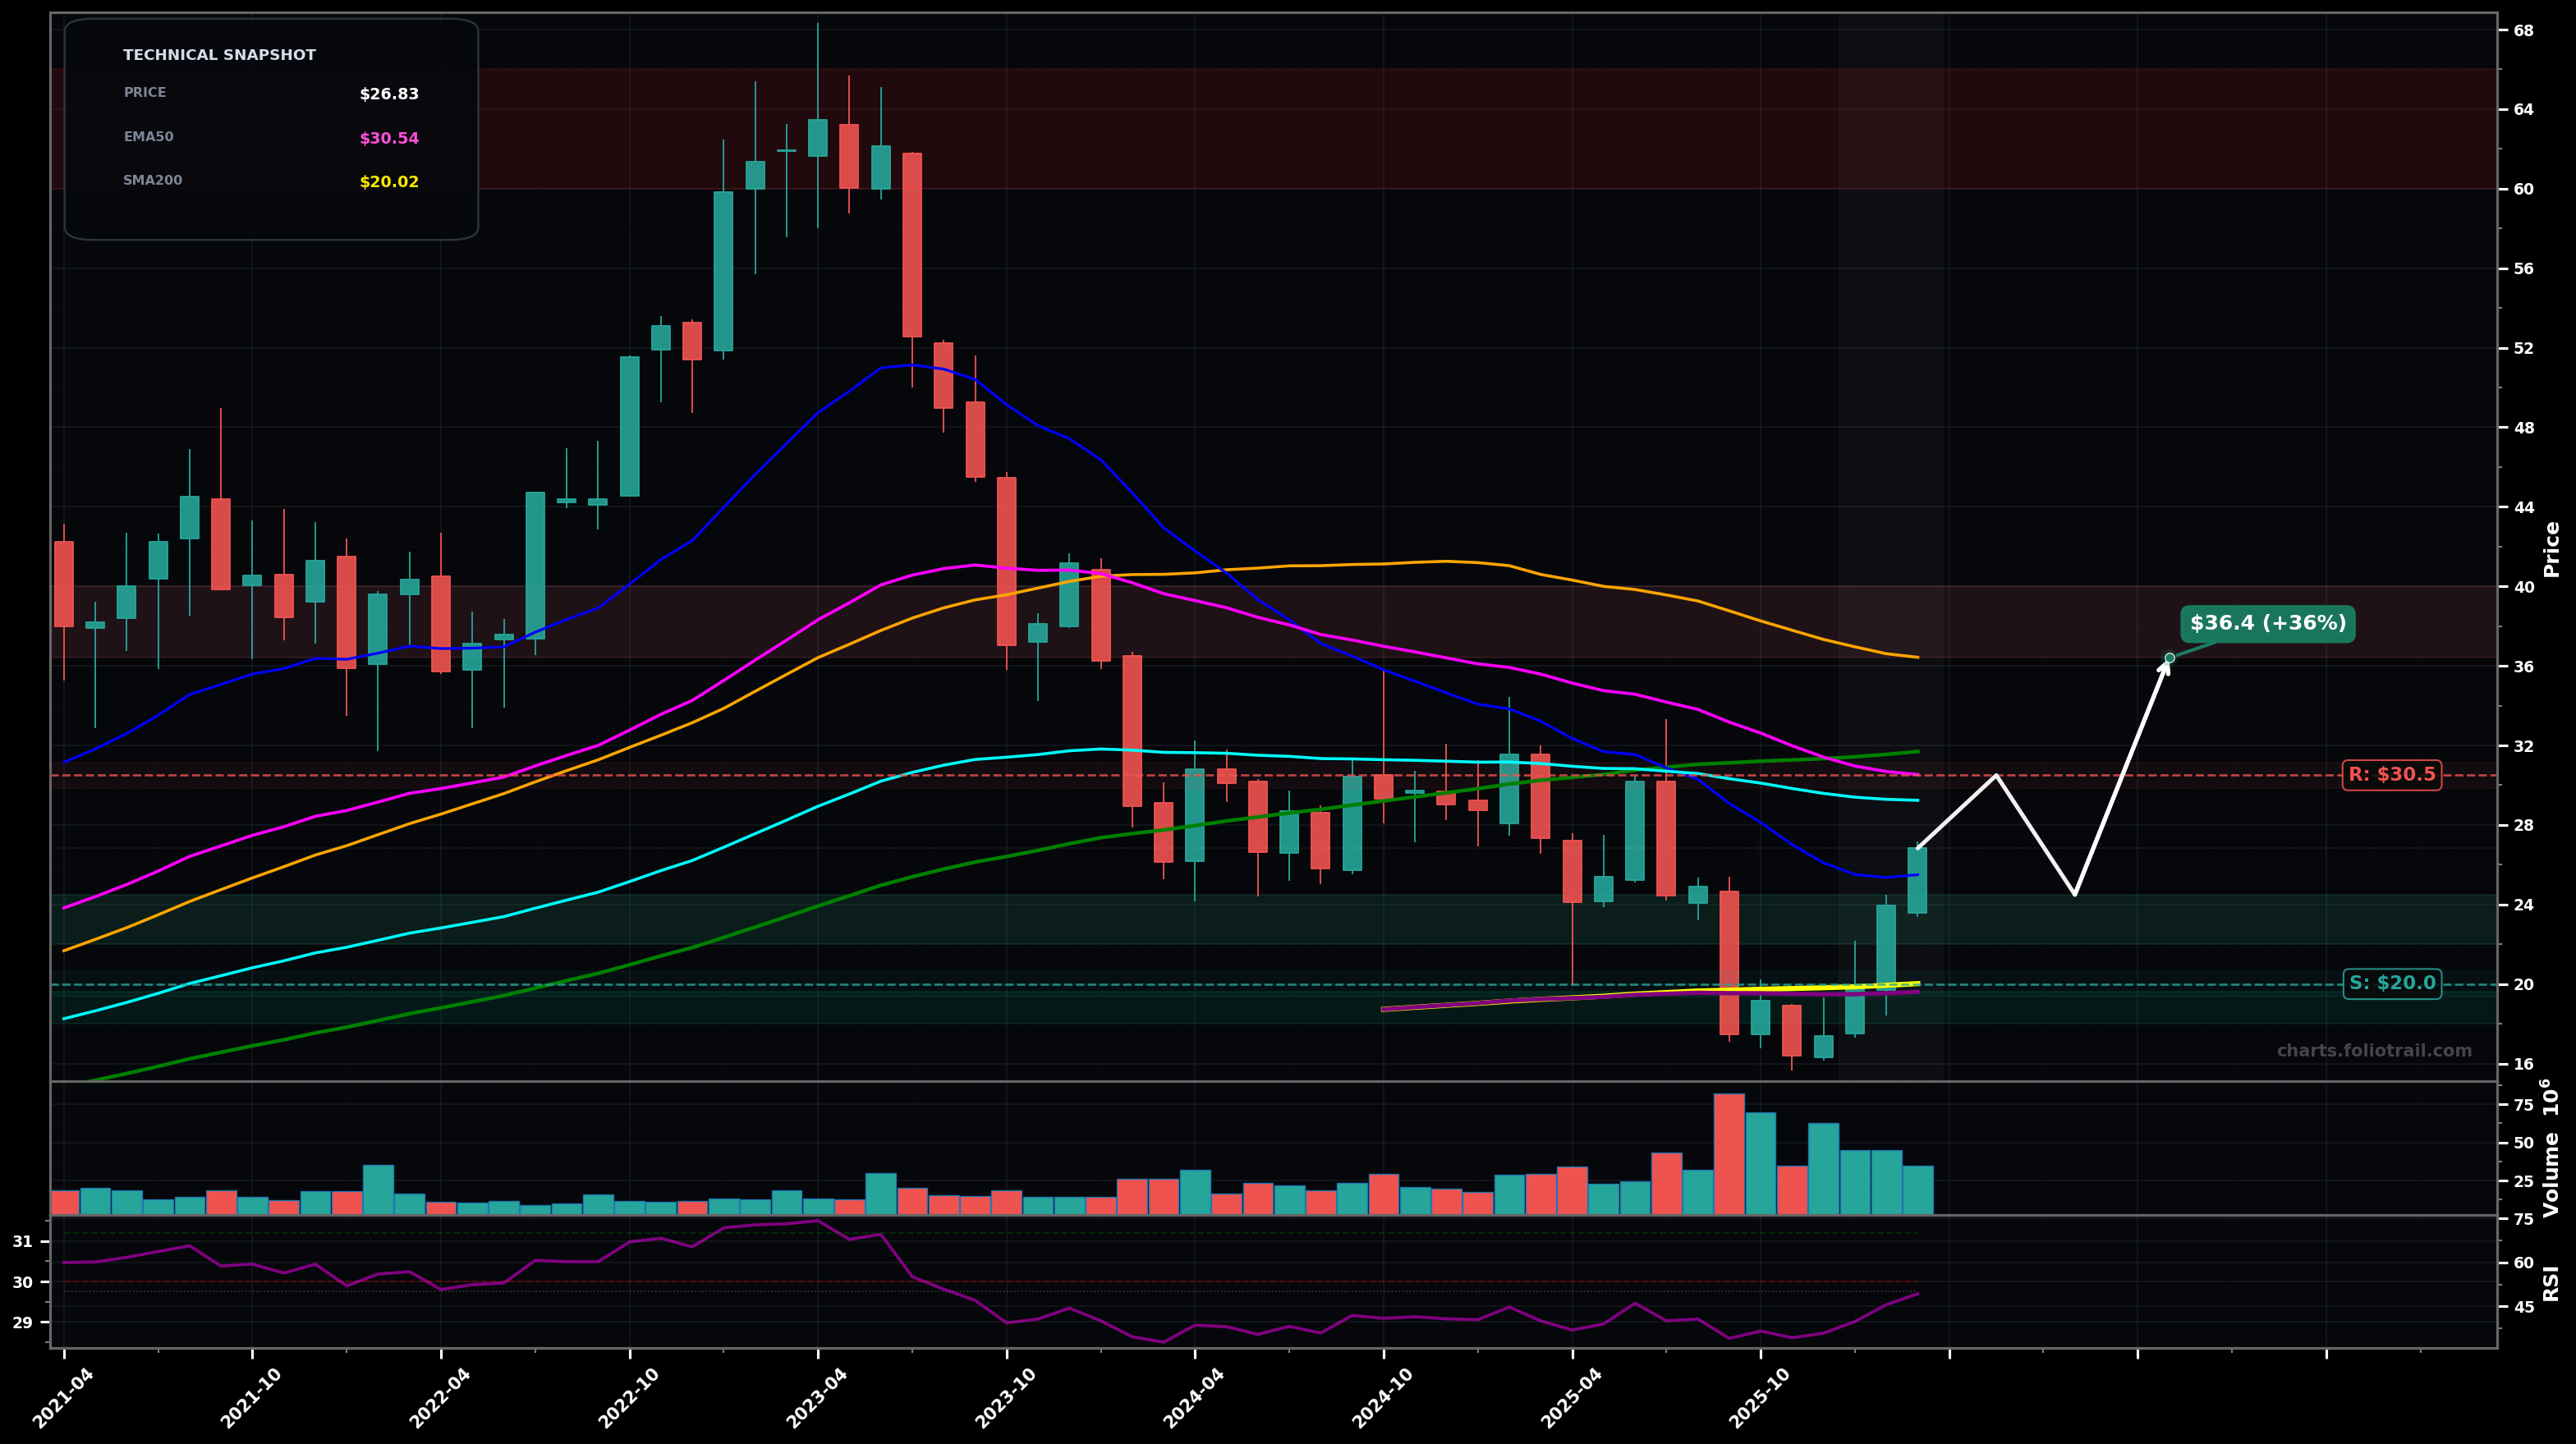
As of May 22, 2026, IRDM (Iridium Communications Inc.) is in a volatility expansion state on the monthly chart, with a confidence level of 74%. Key support is at $36.5 and key resistance at $52.0. Monthly breakout/vertical rally from the $17–$20 base, reclaiming EMA50/EMA100 and pushing above SMA50; RSI14 ~68 with expanding volume (momentum + extension).
Bullish continuation (impulse extension): after a brief consolidation/pullback, price retests the breakout zone (around SMA50/old supply) and then makes a push toward the prior distribution area near the low-$50s; this fits an Elliott Wave-style Wave 3 extension from the $17–$20 swing low with a likely Wave 4 dip before another leg up.
Bearish mean-reversion: the move is overextended (RSI ~68) and rejects near the $50–$52 supply zone, leading to a deeper pullback to the reclaimed MAs; if $36–$40 fails, price gravitates toward the next structural support near the mid-$20s (EMA200/pivot zone).
2 monthly closes holding above $44.00
Monthly close back below $36.50
Start on first pullback into breakout support ($36–$40); add near EMA50/SMA100 cluster ($31–$34); heavy add near EMA200 (purple)/prior base support ($24–$27) if a deeper Wave-4 style retrace occurs.
Trim into overhead supply and Fibonacci-style extensions from the $17–$20 swing low (psych levels $60/$68) as momentum becomes stretched; close if price reaches extreme extension vs EMA50/100 with euphoric candles/volume.
As of May 22, 2026, IRDM (Iridium Communications Inc.) is in a volatility expansion state on the monthly chart with 74% confidence. Monthly breakout/vertical rally from the $17–$20 base, reclaiming EMA50/EMA100 and pushing above SMA50; RSI14 ~68 with expanding volume (momentum + extension).
On the monthly timeframe, IRDM has key support at $36.5 and key resistance at $52.0. The most likely scenario (bullish) targets $52.0 and $60.0, with a revert level at $40.0.
IRDM (Iridium Communications Inc.) is currently classified as volatility expansion on the monthly chart, with 74% confidence. Confirmation requires: 2 monthly closes holding above $44.00 This would be invalidated by: Monthly close back below $36.50
The most likely scenario (bullish) targets $52.0 and $60.0, with a revert level at $40.0. The alternative scenario (bearish) targets $36.5 and $29.5.
Multi-layer AI agents analyse 200+ stocks across daily, weekly, and monthly timeframes — producing market state classifications, price scenarios with targets, and position entry/exit levels. Daily charts updated every trading day at 6 PM ET. Weekly charts refresh Fridays. Monthly charts refresh on the last trading day of each month. No paywall. No sign-up required.
Built by Foliotrail.
All content on this website — including charts, analysis, price targets, support/resistance levels, and position zones — is generated entirely by AI and provided for educational and informational purposes only.
This is not financial advice. NEXUSNOIR VENTURES SL (the operator of this website) is not a registered investment adviser or broker-dealer. You should not make investment decisions based solely on this information. Always do your own research and consult a qualified financial advisor.
By continuing, you acknowledge that you have read and agree to our full disclaimer & terms of use and privacy policy.