As of May 22, 2026, IRDM (Iridium Communications Inc.) is in a volatility expansion state on the weekly chart, with a confidence level of 74%. Key support is at $44.0 and key resistance at $52.0. Weekly impulsive breakout to ~$48.87 with expanding volume; price reclaimed all key MAs (EMA50/100/200 + SMA200) and RSI is very overbought (~83.7).
Bullish continuation: wave-3-like extension continues after a brief consolidation; price holds above prior breakout zone and grinds/pushes into the low $50s, then attempts a higher high into mid/high $50s.
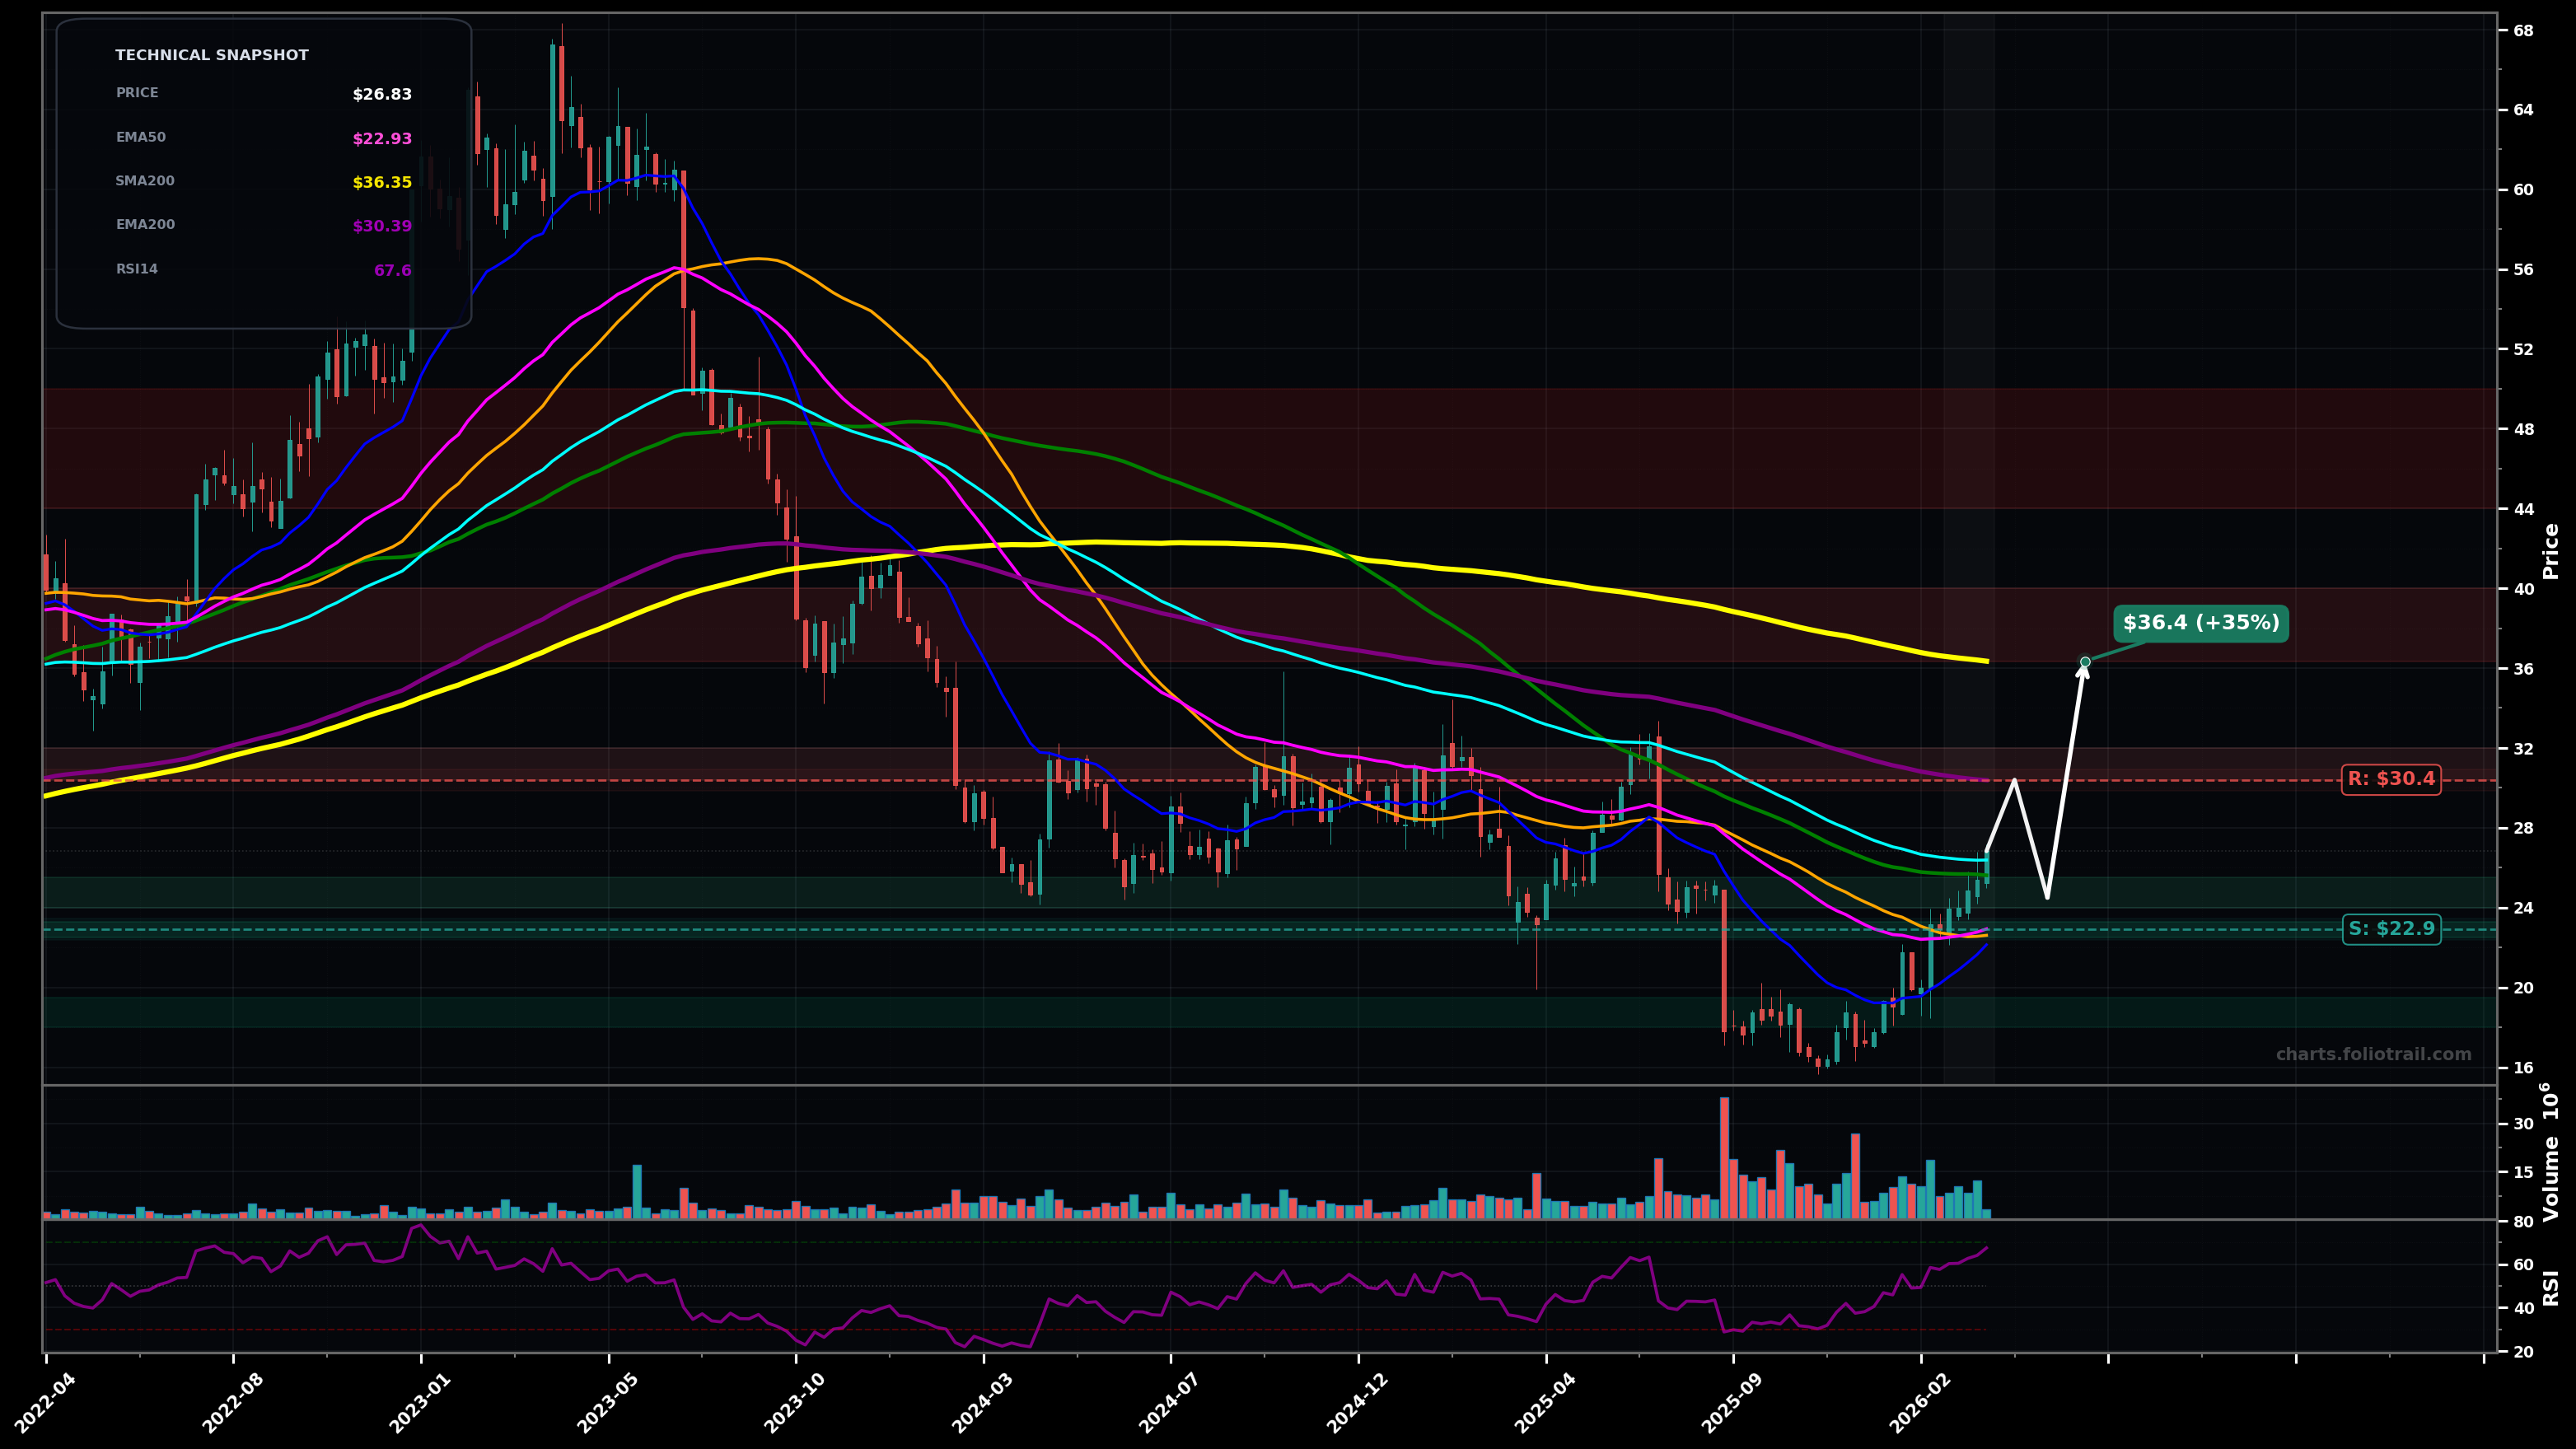
Bearish mean-reversion: after an overbought spike (RSI >80), a deeper pullback retests the big MA cluster; if momentum fades, price retraces toward the $36-$38 area before deciding trend.
Hold (2 weekly closes) above $44.00
Weekly close back below $36.40 (SMA200)
Buy-the-dip zones align with breakout retest ($44), then SMA200 support (~$36.4); heavy add only if a full mean-reversion hits EMA100/EMA200 area (~$28-$31).
Price is currently extremely stretched above EMA50/100/200; trims map to Fibonacci-style extension areas from the last major base-to-breakout leg and prior supply near the low/mid $60s.
As of May 22, 2026, IRDM (Iridium Communications Inc.) is in a volatility expansion state on the weekly chart with 74% confidence. Weekly impulsive breakout to ~$48.87 with expanding volume; price reclaimed all key MAs (EMA50/100/200 + SMA200) and RSI is very overbought (~83.7).
On the weekly timeframe, IRDM has key support at $44.0 and key resistance at $52.0. The most likely scenario (bullish) targets $52.0 and $58.0, with a revert level at $44.0.
IRDM (Iridium Communications Inc.) is currently classified as volatility expansion on the weekly chart, with 74% confidence. Confirmation requires: Hold (2 weekly closes) above $44.00 This would be invalidated by: Weekly close back below $36.40 (SMA200)
The most likely scenario (bullish) targets $52.0 and $58.0, with a revert level at $44.0. The alternative scenario (bearish) targets $40.0 and $36.4.
Multi-layer AI agents analyse 200+ stocks across daily, weekly, and monthly timeframes — producing market state classifications, price scenarios with targets, and position entry/exit levels. Daily charts updated every trading day at 6 PM ET. Weekly charts refresh Fridays. Monthly charts refresh on the last trading day of each month. No paywall. No sign-up required.
Built by Foliotrail.
All content on this website — including charts, analysis, price targets, support/resistance levels, and position zones — is generated entirely by AI and provided for educational and informational purposes only.
This is not financial advice. NEXUSNOIR VENTURES SL (the operator of this website) is not a registered investment adviser or broker-dealer. You should not make investment decisions based solely on this information. Always do your own research and consult a qualified financial advisor.
By continuing, you acknowledge that you have read and agree to our full disclaimer & terms of use and privacy policy.