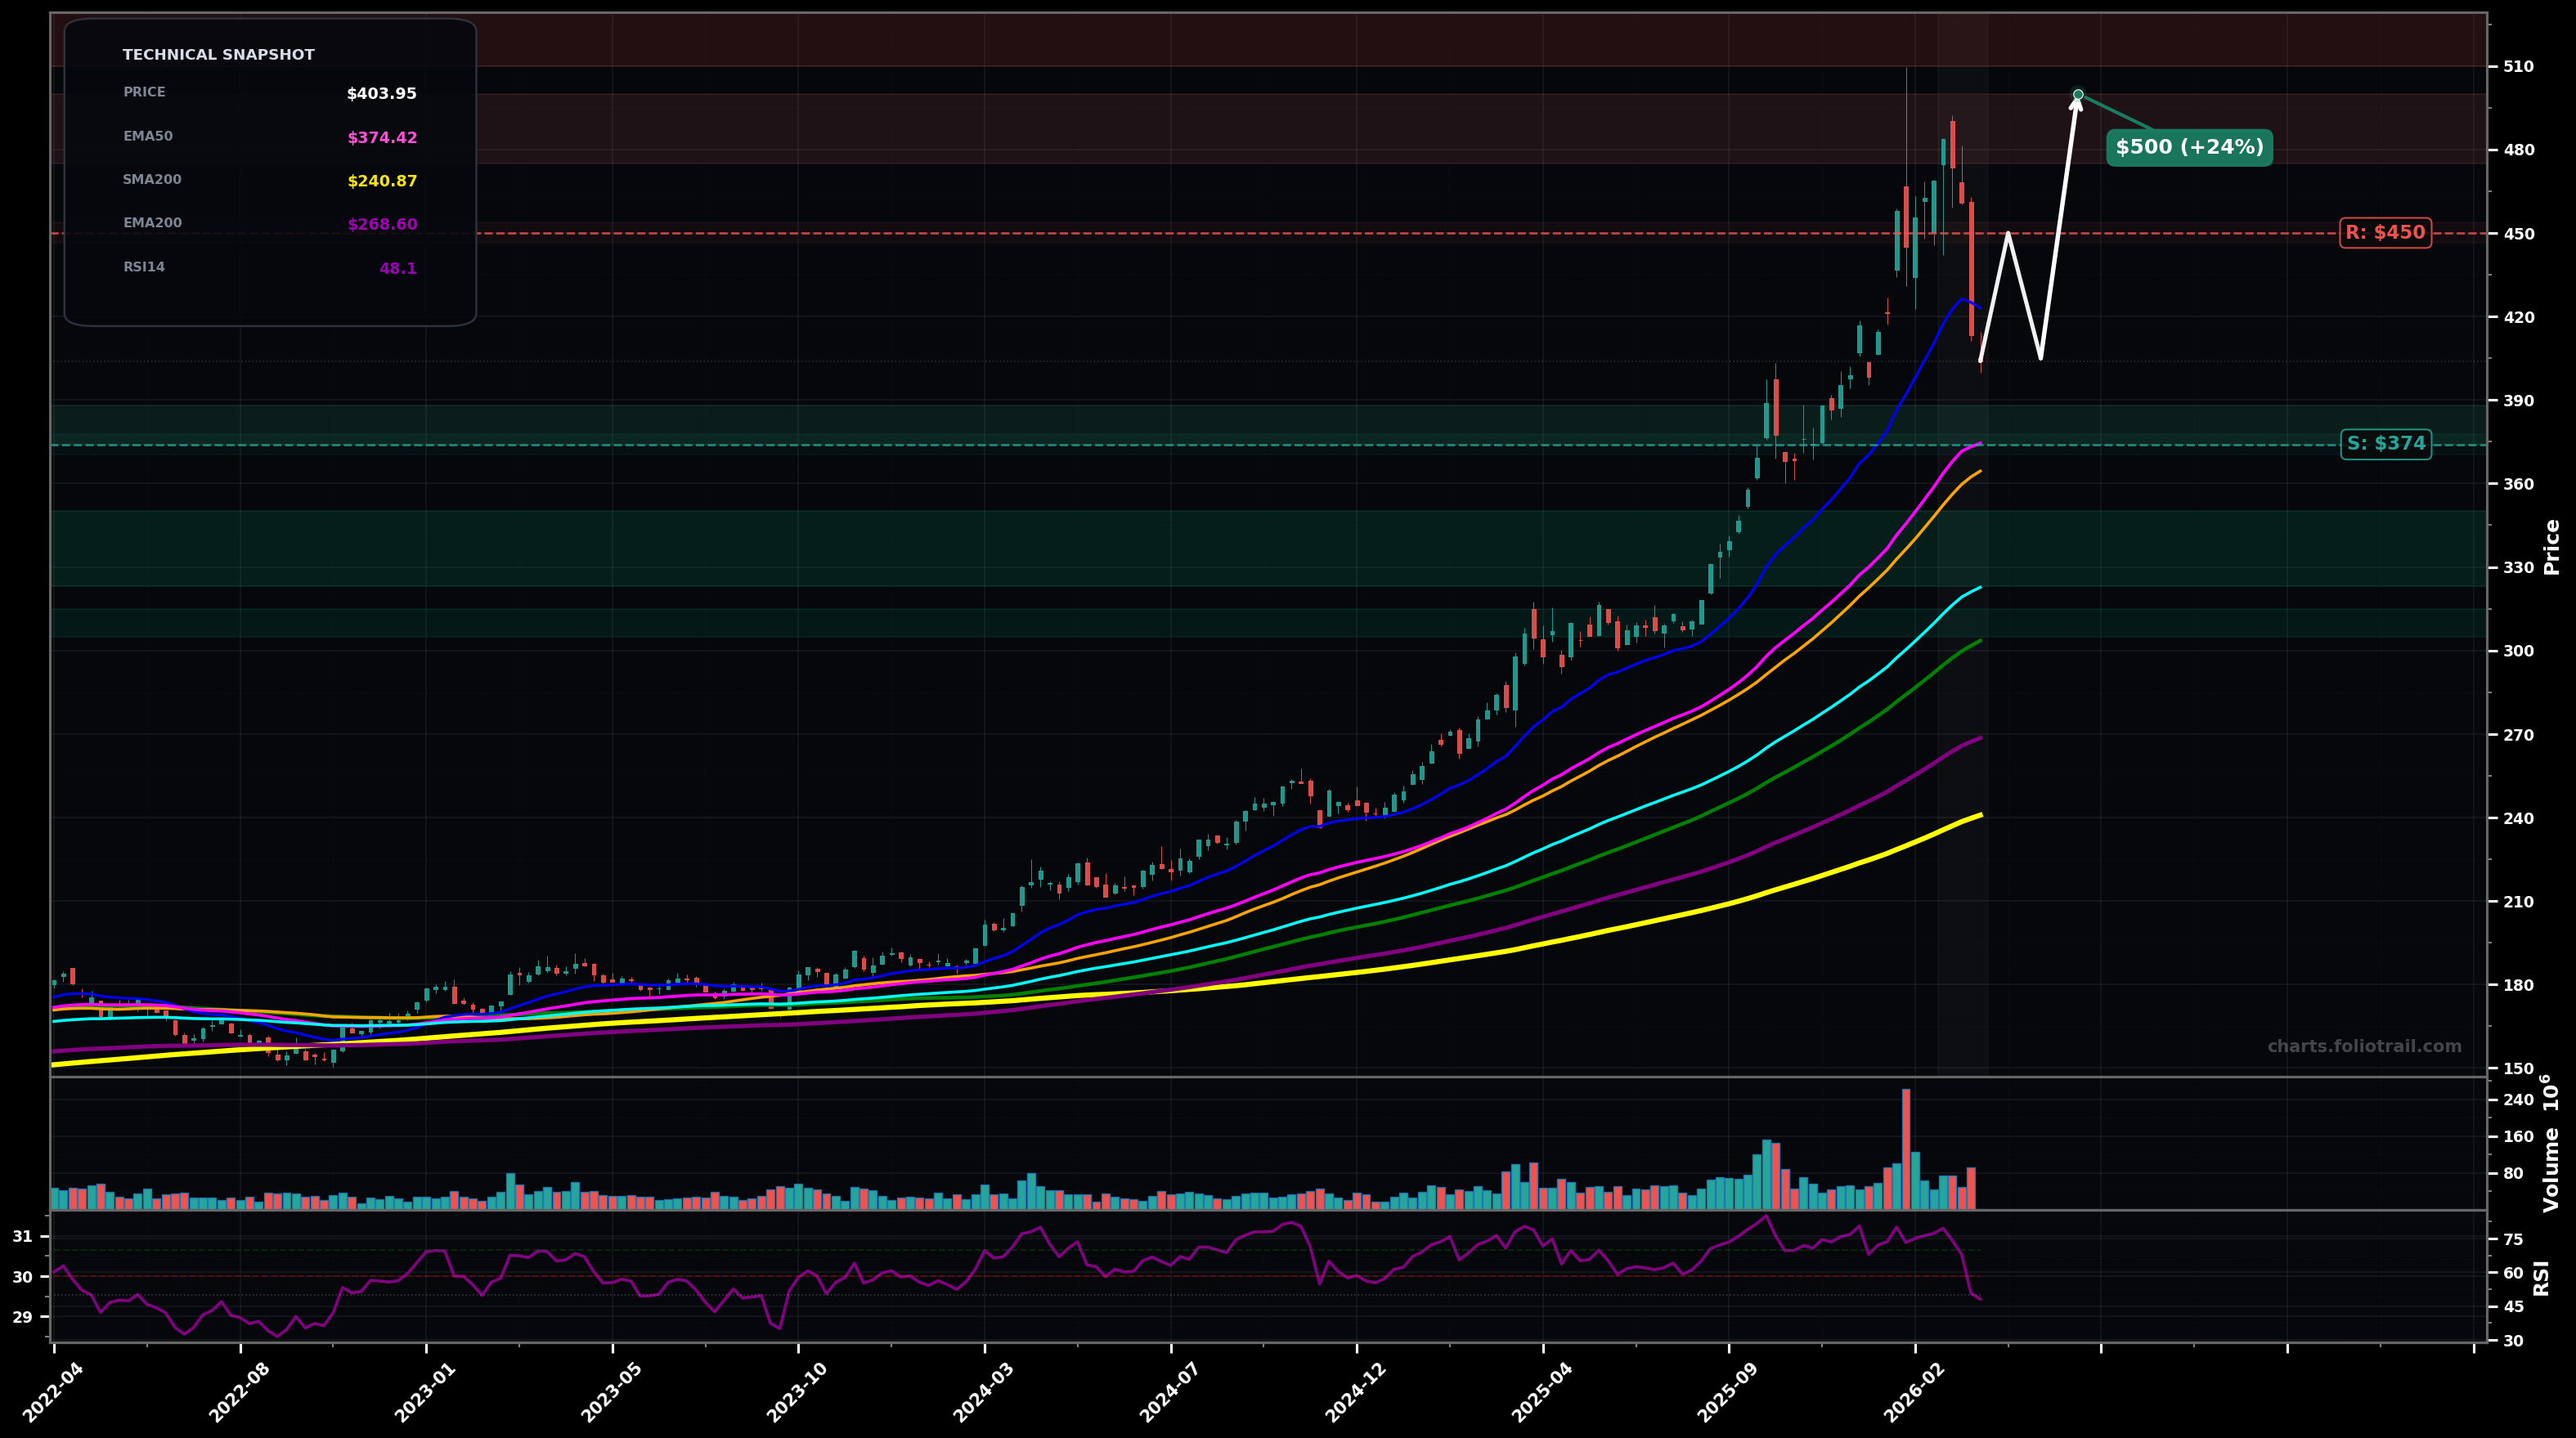
As of March 23, 2026, GLD (SPDR Gold Shares) is in a volatility expansion state on the weekly chart, with a confidence level of 62%. Key support is at $374 and key resistance at $450. Weekly pullback from the ~$500 blow-off high; price (~$403.95) is still above rising EMA50 (~$374) and SMA50 (~$364) but momentum cooled (RSI14 ~48).
Bullish continuation after a controlled pullback: price holds the $390–$374 area (EMA50/SMA50 cluster), forms a higher low, then grinds back toward prior breakdown levels.
Deeper corrective leg (Elliott Wave-style Wave 4 / ABC): a weekly close below EMA50 opens a mean-reversion move toward EMA100 and prior consolidation.
State confirms if weekly candles keep printing wide ranges and price breaks and closes below $374 (EMA50) with follow-through.
State invalidates if price reclaims $450 and holds 2+ weekly closes (volatility contraction + trend resumption).
Start near EMA50/SMA50 support; add if Wave-4/ABC extends toward EMA100; heavy add into SMA100 (~$304) where long-term trend support should be strongest unless the major uptrend breaks.
Trim into prior blow-off high supply (~$500) and potential Fibonacci extension zone above it; full exit only if price becomes extremely stretched far above the MA stack (late-cycle/terminal advance risk).
As of March 23, 2026, GLD (SPDR Gold Shares) is in a volatility expansion state on the weekly chart with 62% confidence. Weekly pullback from the ~$500 blow-off high; price (~$403.95) is still above rising EMA50 (~$374) and SMA50 (~$364) but momentum cooled (RSI14 ~48).
On the weekly timeframe, GLD has key support at $374 and key resistance at $450. The most likely scenario (bullish) targets $450 and $500, with a revert level at $405.
GLD (SPDR Gold Shares) is currently classified as volatility expansion on the weekly chart, with 62% confidence. Confirmation requires: State confirms if weekly candles keep printing wide ranges and price breaks and closes below $374 (EMA50) with follow-through. This would be invalidated by: State invalidates if price reclaims $450 and holds 2+ weekly closes (volatility contraction + trend resumption).
The most likely scenario (bullish) targets $450 and $500, with a revert level at $405. The alternative scenario (bearish) targets $323 and $304.
All content on this website — including charts, analysis, price targets, support/resistance levels, and position zones — is generated entirely by AI and provided for educational and informational purposes only.
This is not financial advice. NEXUSNOIR VENTURES SL (the operator of this website) is not a registered investment adviser or broker-dealer. You should not make investment decisions based solely on this information. Always do your own research and consult a qualified financial advisor.
By continuing, you acknowledge that you have read and agree to our full disclaimer & terms of use and privacy policy.