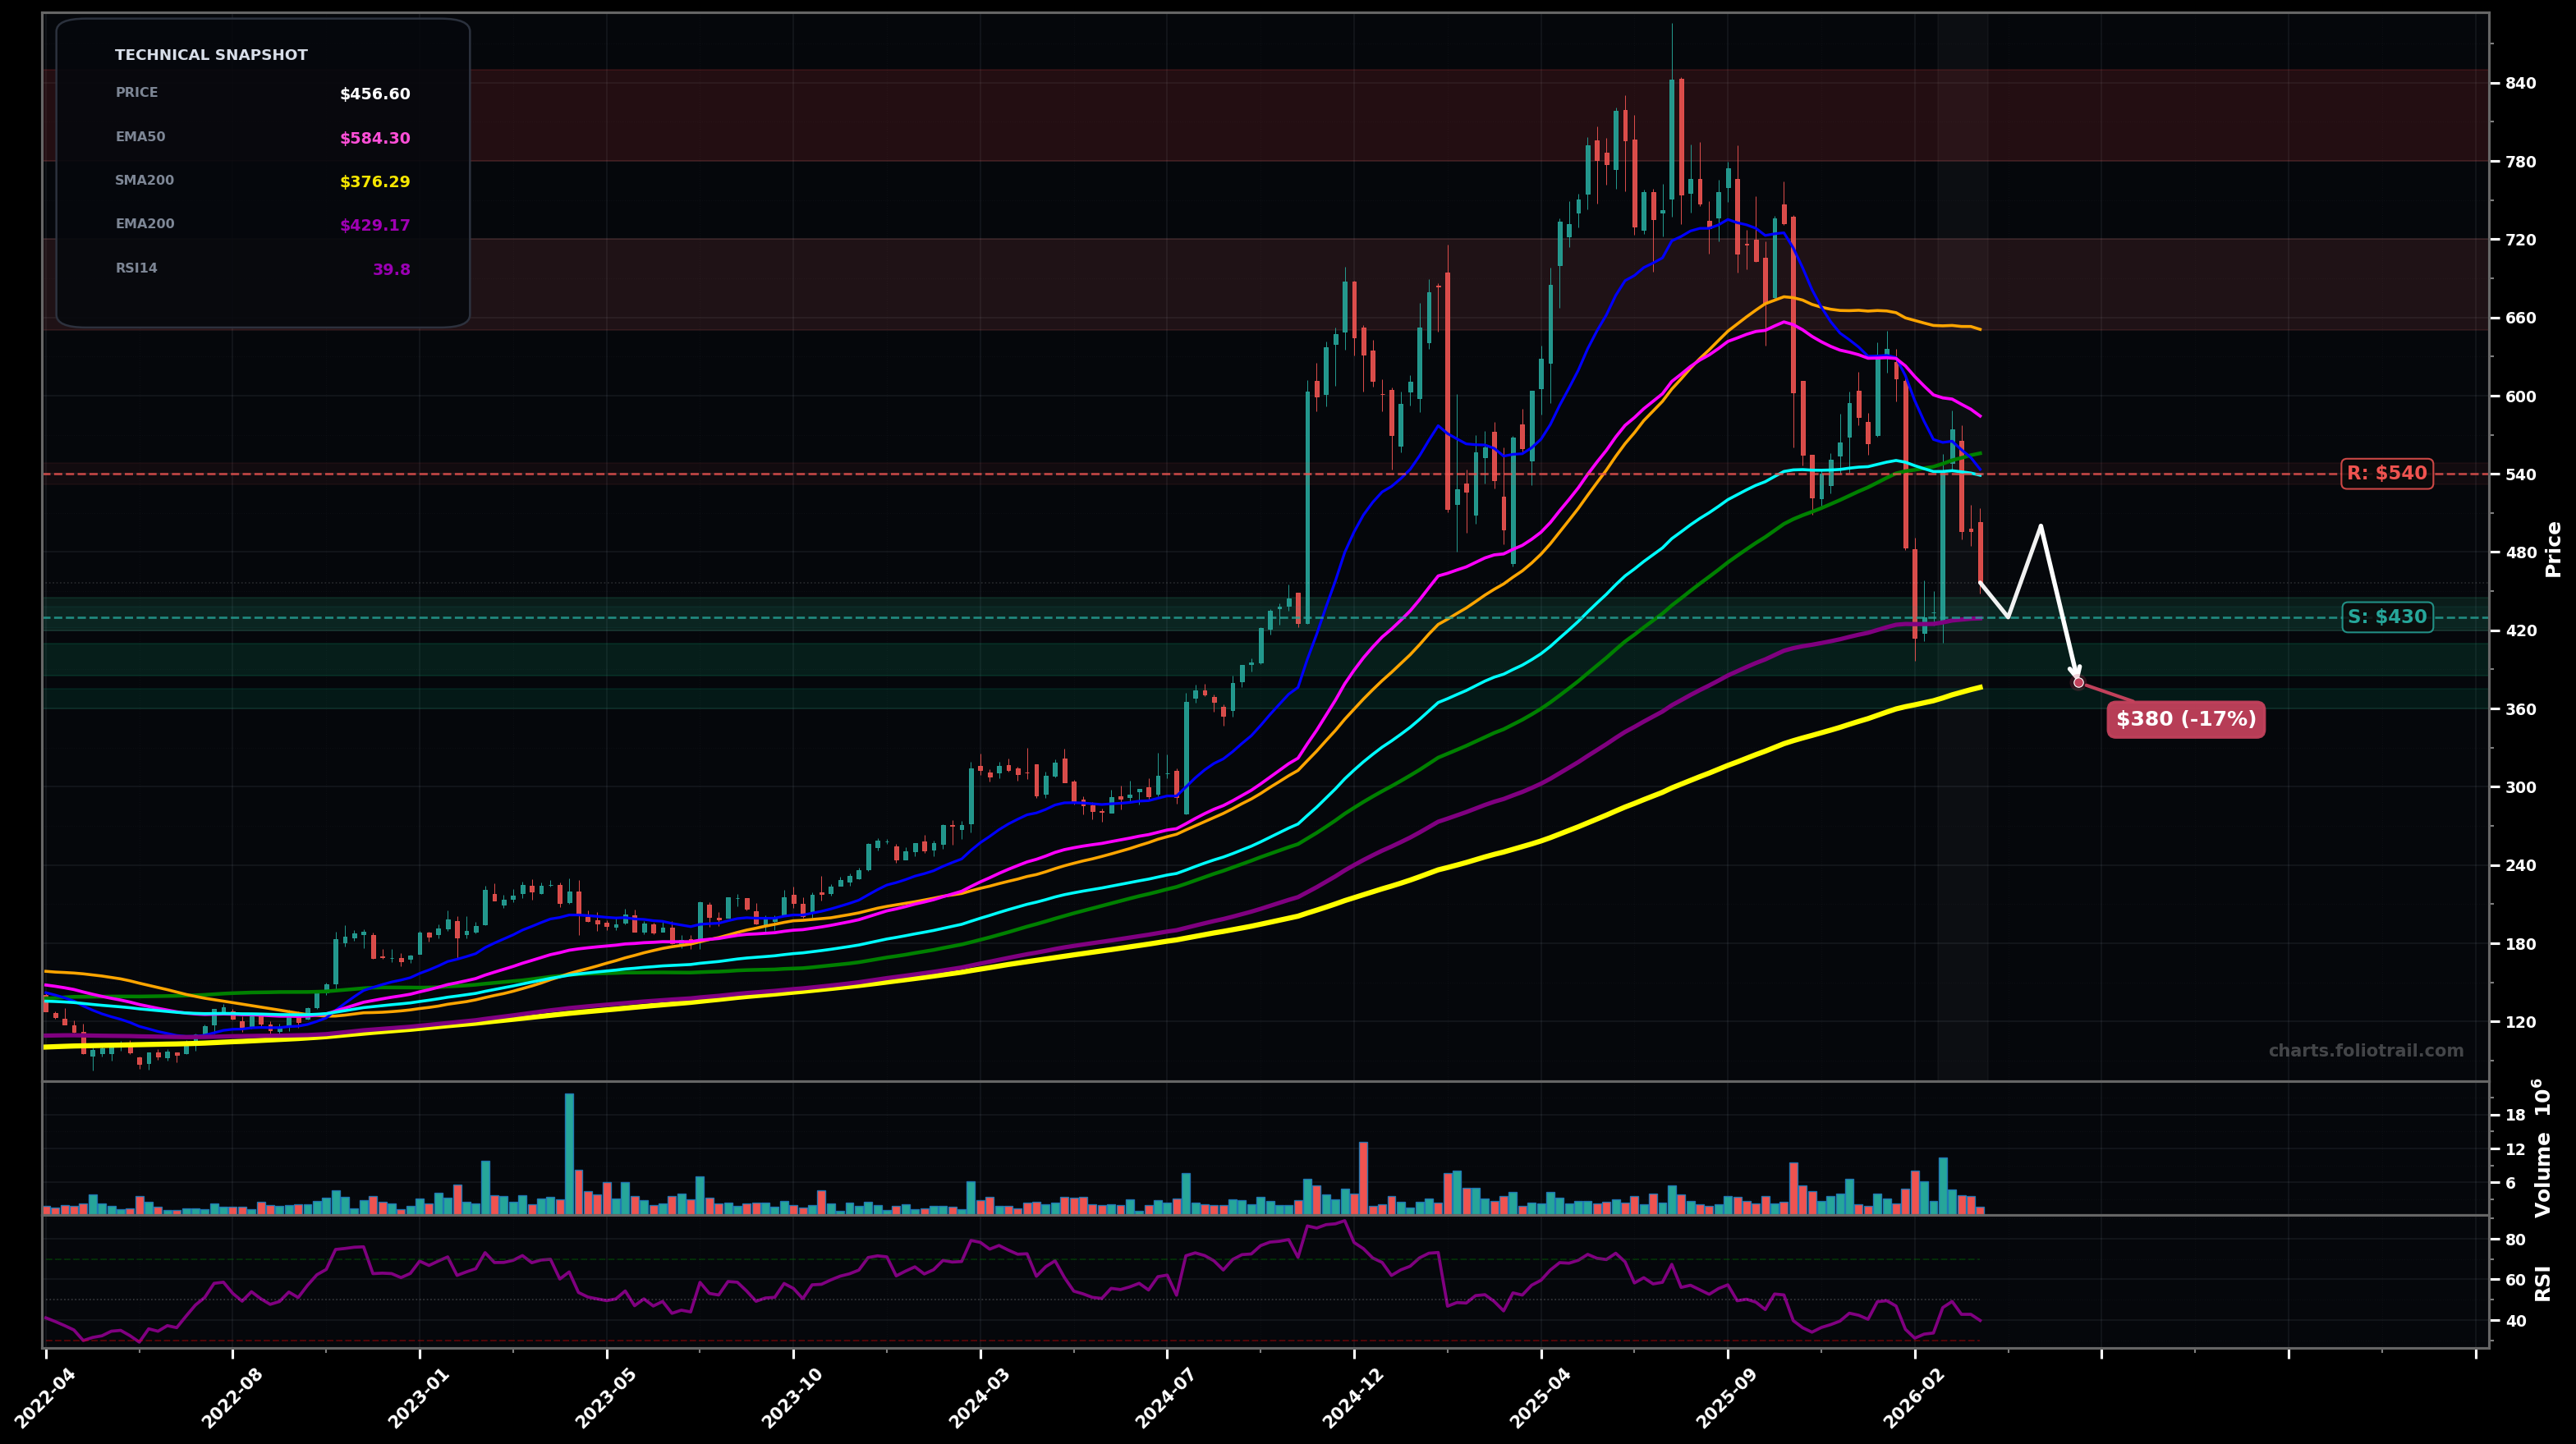
As of March 25, 2026, AXON (Axon Enterprise, Inc.) is in a downtrend state on the weekly chart, with a confidence level of 74%. Key support is at $430 and key resistance at $540. Weekly downswings continue after a sharp breakdown; price ($456.60) is below EMA50/EMA100 and rejected near the ~$540–$560 area; RSI14 ~39.8 (weak momentum, not deeply oversold).
Bearish continuation: weak bounce attempts fail under the $540–$585 MA ceiling, then price drifts/flushes to test the EMA200 region and prior breakdown zone.
Bullish relief + base attempt: holds above EMA200 and forms a higher low; then reclaims EMA100 and works into a wider mean-reversion move toward EMA50/overhead supply.
Weekly close below $430 (EMA200 area) followed by another close holding below $430.
Two weekly closes back above $585 (EMA50) with higher low holding above $540 (EMA100).
Buy zones are centered on EMA200 (~$429) then the rising SMA200 (~$376) as higher-timeframe dynamic supports and likely Wave-4/Wave-A-C basing areas; scale in only if price stabilizes (HL/failed breakdown).
Trim into mean-reversion above the $650+ overhead supply (SMA50/100 region) and prior distribution highs; full exit only if price becomes multi-year stretched versus long MAs (parabolic-type extension back above prior peak zone).
As of March 25, 2026, AXON (Axon Enterprise, Inc.) is in a downtrend state on the weekly chart with 74% confidence. Weekly downswings continue after a sharp breakdown; price ($456.60) is below EMA50/EMA100 and rejected near the ~$540–$560 area; RSI14 ~39.8 (weak momentum, not deeply oversold).
On the weekly timeframe, AXON has key support at $430 and key resistance at $540. The most likely scenario (bearish) targets $430 and $380, with a revert level at $500.
AXON (Axon Enterprise, Inc.) is currently classified as downtrend on the weekly chart, with 74% confidence. Confirmation requires: Weekly close below $430 (EMA200 area) followed by another close holding below $430. This would be invalidated by: Two weekly closes back above $585 (EMA50) with higher low holding above $540 (EMA100).
The most likely scenario (bearish) targets $430 and $380, with a revert level at $500. The alternative scenario (bullish) targets $540 and $585.
Multi-layer AI agents analyse 200+ stocks across daily, weekly, and monthly timeframes — producing market state classifications, price scenarios with targets, and position entry/exit levels. Updated every trading day after market close. No paywall. No sign-up required.
Built by Foliotrail.
All content on this website — including charts, analysis, price targets, support/resistance levels, and position zones — is generated entirely by AI and provided for educational and informational purposes only.
This is not financial advice. NEXUSNOIR VENTURES SL (the operator of this website) is not a registered investment adviser or broker-dealer. You should not make investment decisions based solely on this information. Always do your own research and consult a qualified financial advisor.
By continuing, you acknowledge that you have read and agree to our full disclaimer & terms of use and privacy policy.