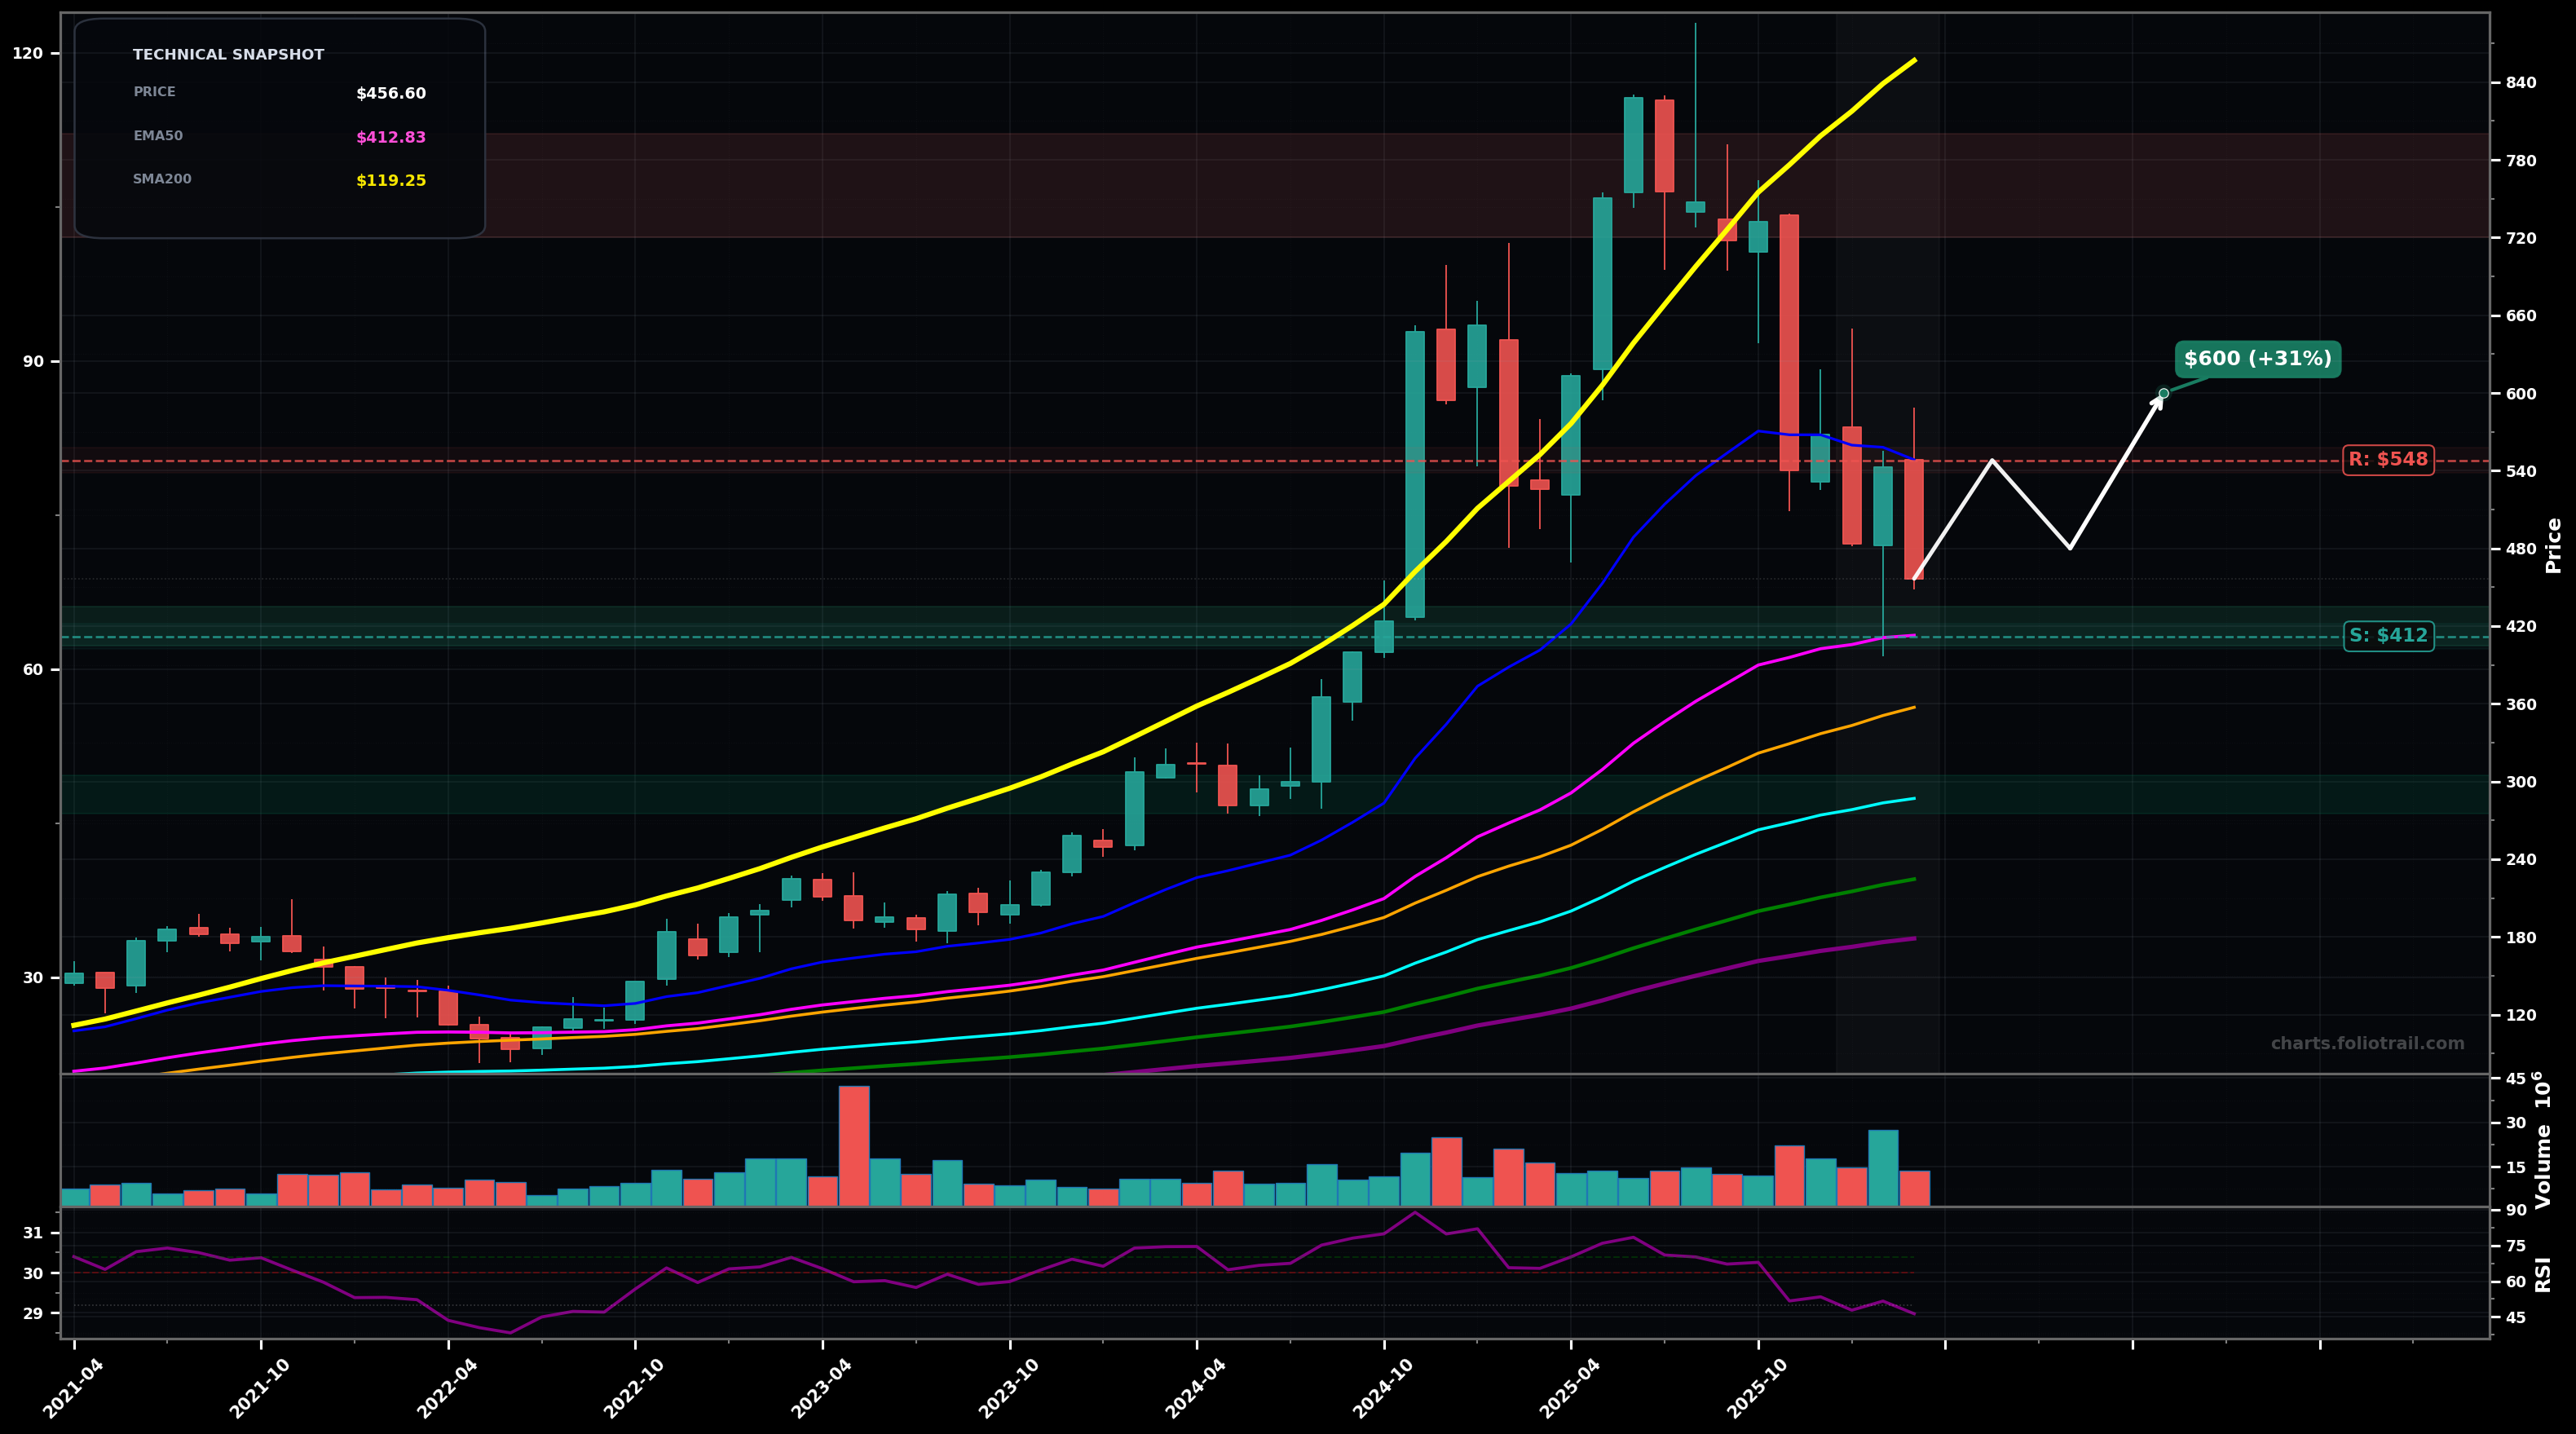
As of May 22, 2026, AXON (Axon Enterprise, Inc.) is in a downtrend state on the monthly chart, with a confidence level of 71%. Key support is at $360 and key resistance at $410. Monthly pullback from ~$830 peak with a sequence of LH/LL; price ~$385 below EMA50 (~$410) and below the rising SMA50 (~$367) after a sharp momentum unwind; RSI14 ~42 (weak but not washed-out).
Base-building / corrective chop: hold the $360-$370 zone (SMA50 + prior demand) and grind back toward the EMA50; likely an Elliott Wave ABC-type correction after a completed impulse into ~$830, with this leg acting as Wave C/2 basing before another attempt higher.
Continuation down: lose $360 on a monthly close, triggering another liquidation leg toward the EMA100/SMA100 confluence; fits a larger Wave 4 (or post-peak Wave A) extending, with a Fibonacci-style retrace toward the ~$290-$230 region.
Confirmed if monthly closes stay below $410 (EMA50) and break below $360 (SMA50 area).
Invalidated if price reclaims and holds above $425 for 2 monthly closes.
Stagger entries at major MA shelves: SMA50/structure ($360-$390), then EMA100/SMA100 demand ($290-$325), then deeper fib/mean-reversion zone near $230-$260 if the monthly trend leg extends.
Trim into overhead supply from the breakdown (prior congestion/EMA20 region) and prior-cycle extremes: first at $520-$600, more at $700-$780, and fully close near prior ATH supply $800-$880 if momentum becomes stretched again.
As of May 22, 2026, AXON (Axon Enterprise, Inc.) is in a downtrend state on the monthly chart with 71% confidence. Monthly pullback from ~$830 peak with a sequence of LH/LL; price ~$385 below EMA50 (~$410) and below the rising SMA50 (~$367) after a sharp momentum unwind; RSI14 ~42 (weak but not washed-out).
On the monthly timeframe, AXON has key support at $360 and key resistance at $410. The most likely scenario (bullish) targets $410 and $520, with a revert level at $380.
AXON (Axon Enterprise, Inc.) is currently classified as downtrend on the monthly chart, with 71% confidence. Confirmation requires: Confirmed if monthly closes stay below $410 (EMA50) and break below $360 (SMA50 area). This would be invalidated by: Invalidated if price reclaims and holds above $425 for 2 monthly closes.
The most likely scenario (bullish) targets $410 and $520, with a revert level at $380. The alternative scenario (bearish) targets $290 and $232.
Multi-layer AI agents analyse 200+ stocks across daily, weekly, and monthly timeframes — producing market state classifications, price scenarios with targets, and position entry/exit levels. Daily charts updated every trading day at 6 PM ET. Weekly charts refresh Fridays. Monthly charts refresh on the last trading day of each month. No paywall. No sign-up required.
Built by Foliotrail.
All content on this website — including charts, analysis, price targets, support/resistance levels, and position zones — is generated entirely by AI and provided for educational and informational purposes only.
This is not financial advice. NEXUSNOIR VENTURES SL (the operator of this website) is not a registered investment adviser or broker-dealer. You should not make investment decisions based solely on this information. Always do your own research and consult a qualified financial advisor.
By continuing, you acknowledge that you have read and agree to our full disclaimer & terms of use and privacy policy.