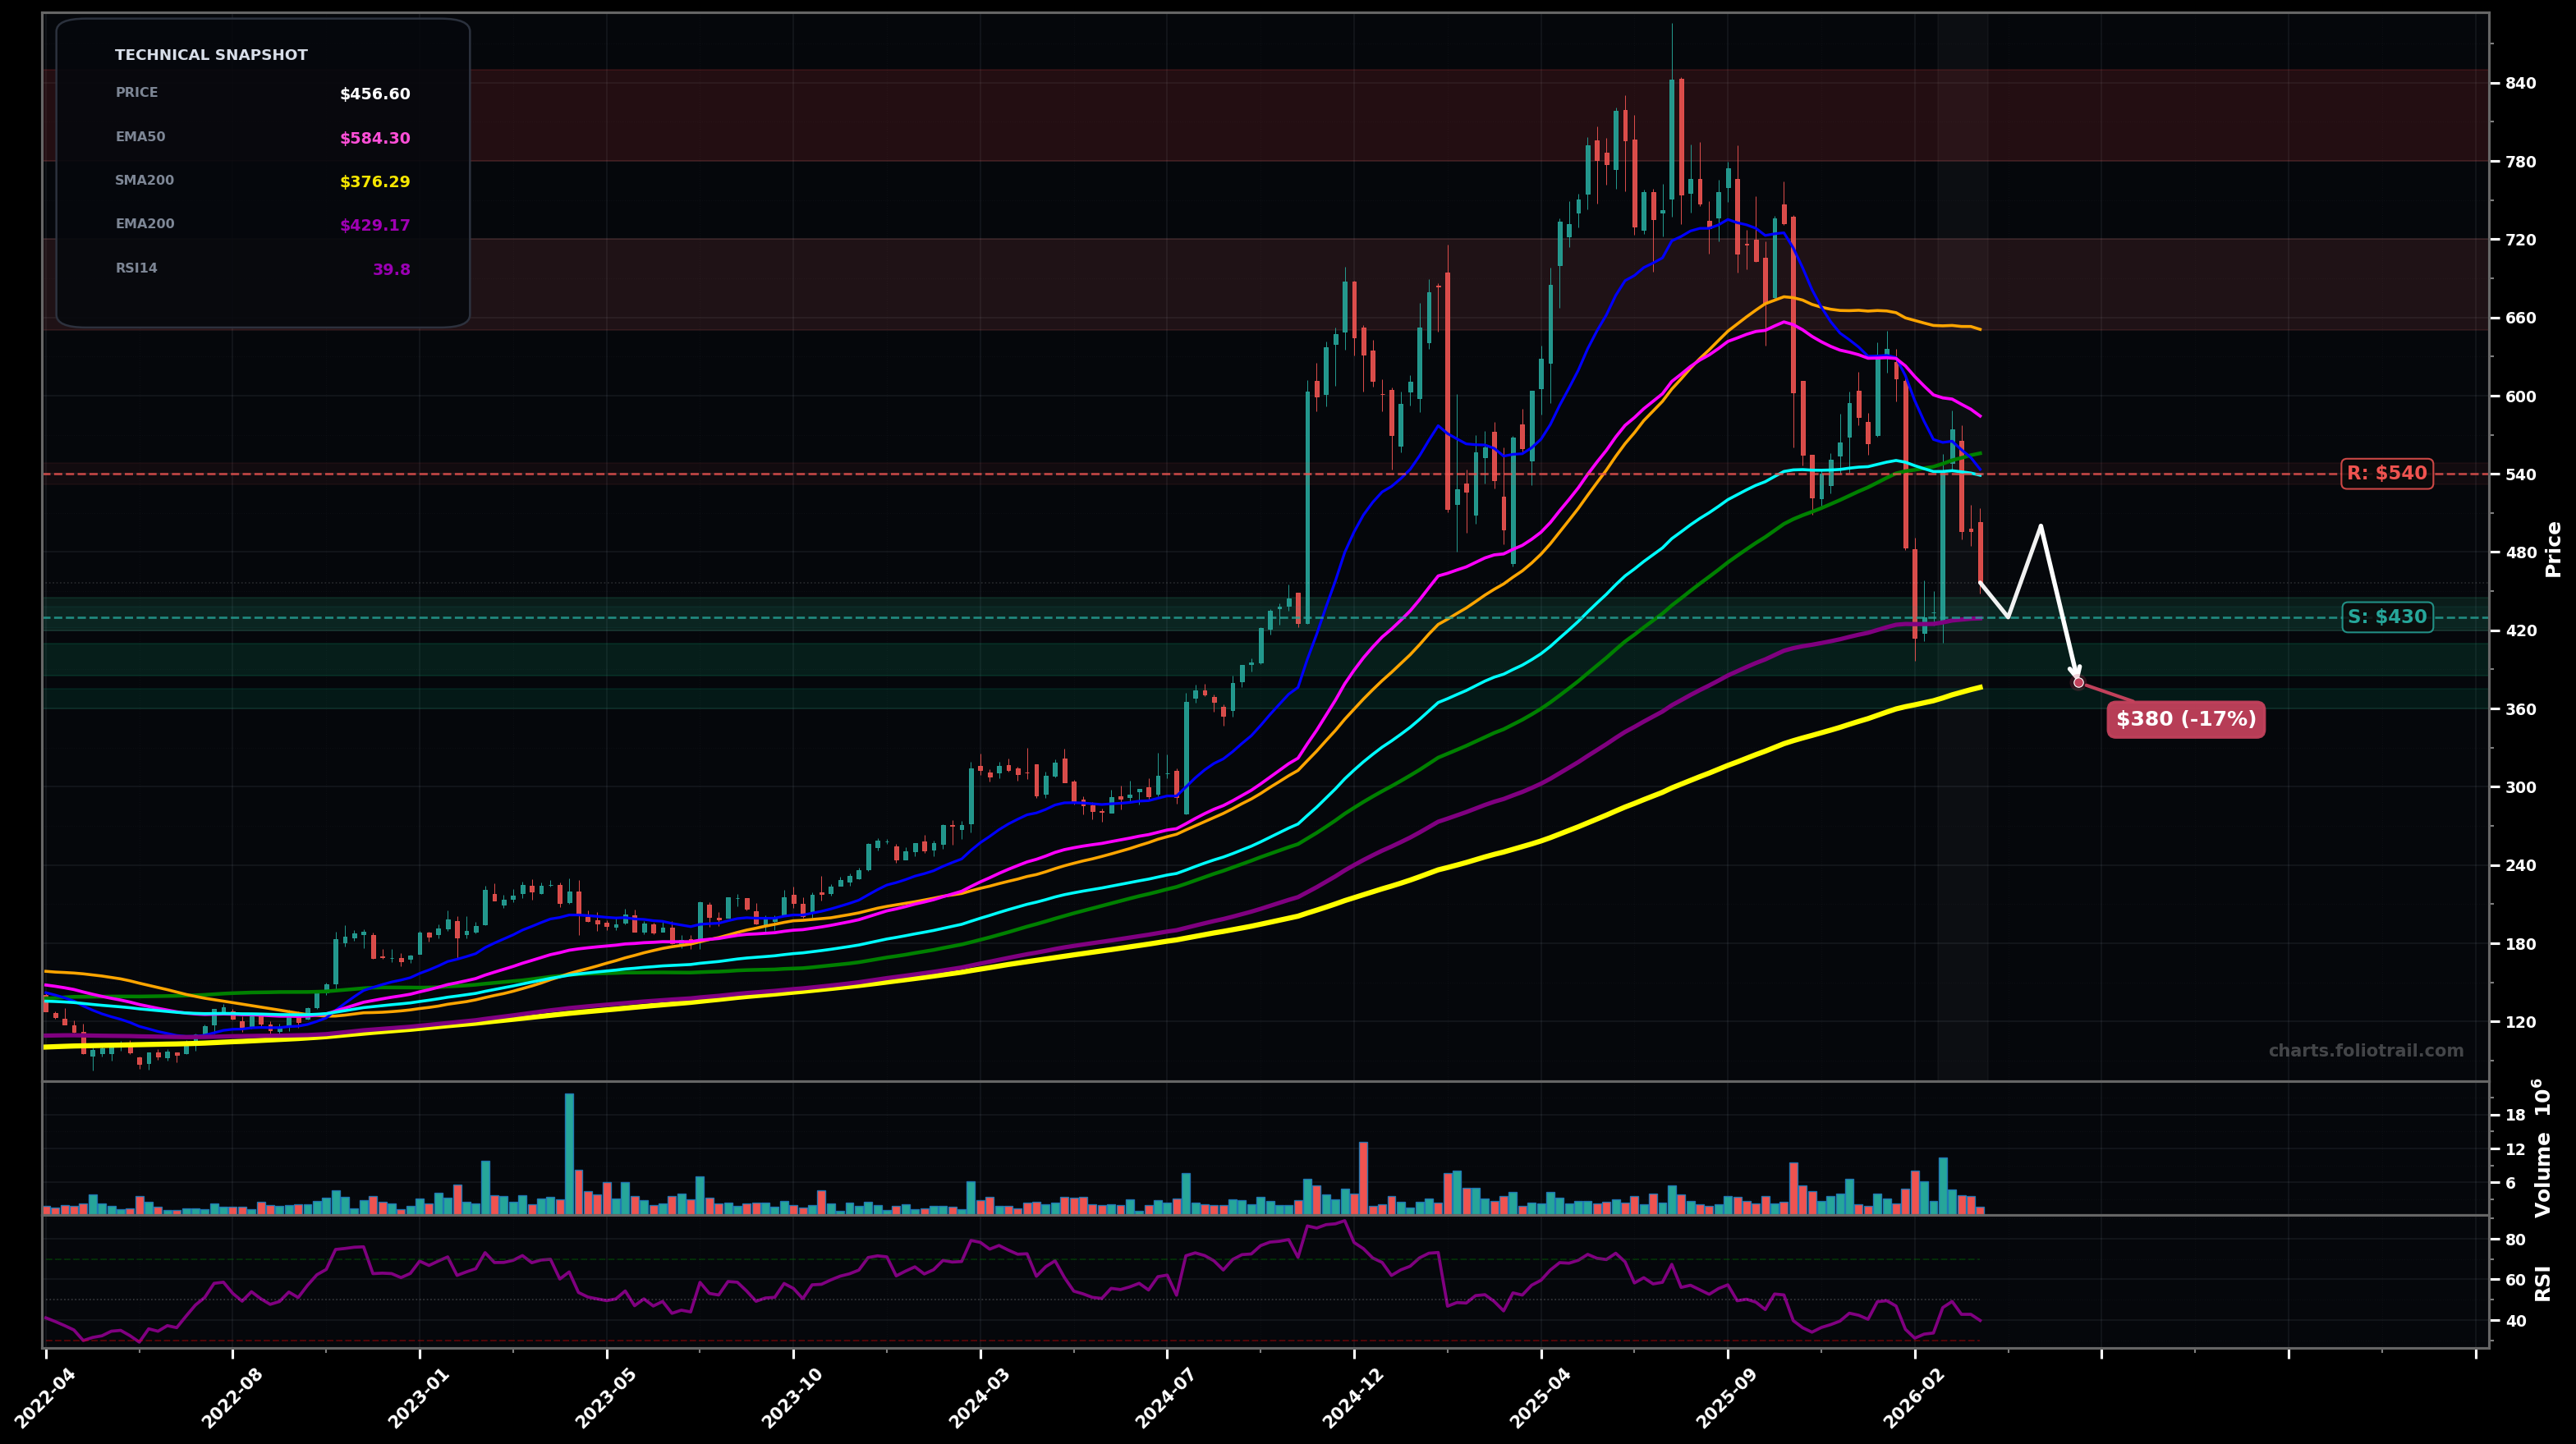
As of May 22, 2026, AXON (Axon Enterprise, Inc.) is in a downtrend state on the weekly chart, with a confidence level of 72%. Key support is at $380 and key resistance at $427. Weekly price is $385.83 after a sharp selloff from the $700s; price is below EMA50/EMA100 and sitting just above the rising long-term SMA200 (~$388), with RSI-14 at 37.85 (weak momentum).
Base attempt on/near SMA200: hold $380–$390, form a higher low, then mean-revert upward into the first MA supply (EMA200) and potentially the EMA20/previous breakdown zone.
SMA200 fails: weekly close < $380 triggers another liquidation leg toward the next fib/structure support band, with any bounce likely capped at former support (~$420–$430).
Weekly close below $380 would confirm downside continuation (clean loss of SMA200 support zone).
2 weekly closes back above $460 would invalidate the immediate downtrend thesis (reclaim EMA20 area and break the rebound ceiling).
Start near rising SMA200 + prior pivot support; add on breakdown-to-support around the next fib/structure shelf; heavy add only if capitulation into the ~$300 round-number/next demand zone with RSI likely deeply oversold.
Trim into major MA supply (EMA100/EMA50 then SMA50/SMA100) where downtrend rallies typically stall; close into prior cycle supply/ATH zone if Elliott-wave-style larger recovery completes and price becomes far stretched above long MAs.
As of May 22, 2026, AXON (Axon Enterprise, Inc.) is in a downtrend state on the weekly chart with 72% confidence. Weekly price is $385.83 after a sharp selloff from the $700s; price is below EMA50/EMA100 and sitting just above the rising long-term SMA200 (~$388), with RSI-14 at 37.85 (weak momentum).
On the weekly timeframe, AXON has key support at $380 and key resistance at $427. The most likely scenario (bullish) targets $427 and $460, with a revert level at $405.
AXON (Axon Enterprise, Inc.) is currently classified as downtrend on the weekly chart, with 72% confidence. Confirmation requires: Weekly close below $380 would confirm downside continuation (clean loss of SMA200 support zone). This would be invalidated by: 2 weekly closes back above $460 would invalidate the immediate downtrend thesis (reclaim EMA20 area and break the rebound ceiling).
The most likely scenario (bullish) targets $427 and $460, with a revert level at $405. The alternative scenario (bearish) targets $340 and $300.
Multi-layer AI agents analyse 200+ stocks across daily, weekly, and monthly timeframes — producing market state classifications, price scenarios with targets, and position entry/exit levels. Daily charts updated every trading day at 6 PM ET. Weekly charts refresh Fridays. Monthly charts refresh on the last trading day of each month. No paywall. No sign-up required.
Built by Foliotrail.
All content on this website — including charts, analysis, price targets, support/resistance levels, and position zones — is generated entirely by AI and provided for educational and informational purposes only.
This is not financial advice. NEXUSNOIR VENTURES SL (the operator of this website) is not a registered investment adviser or broker-dealer. You should not make investment decisions based solely on this information. Always do your own research and consult a qualified financial advisor.
By continuing, you acknowledge that you have read and agree to our full disclaimer & terms of use and privacy policy.