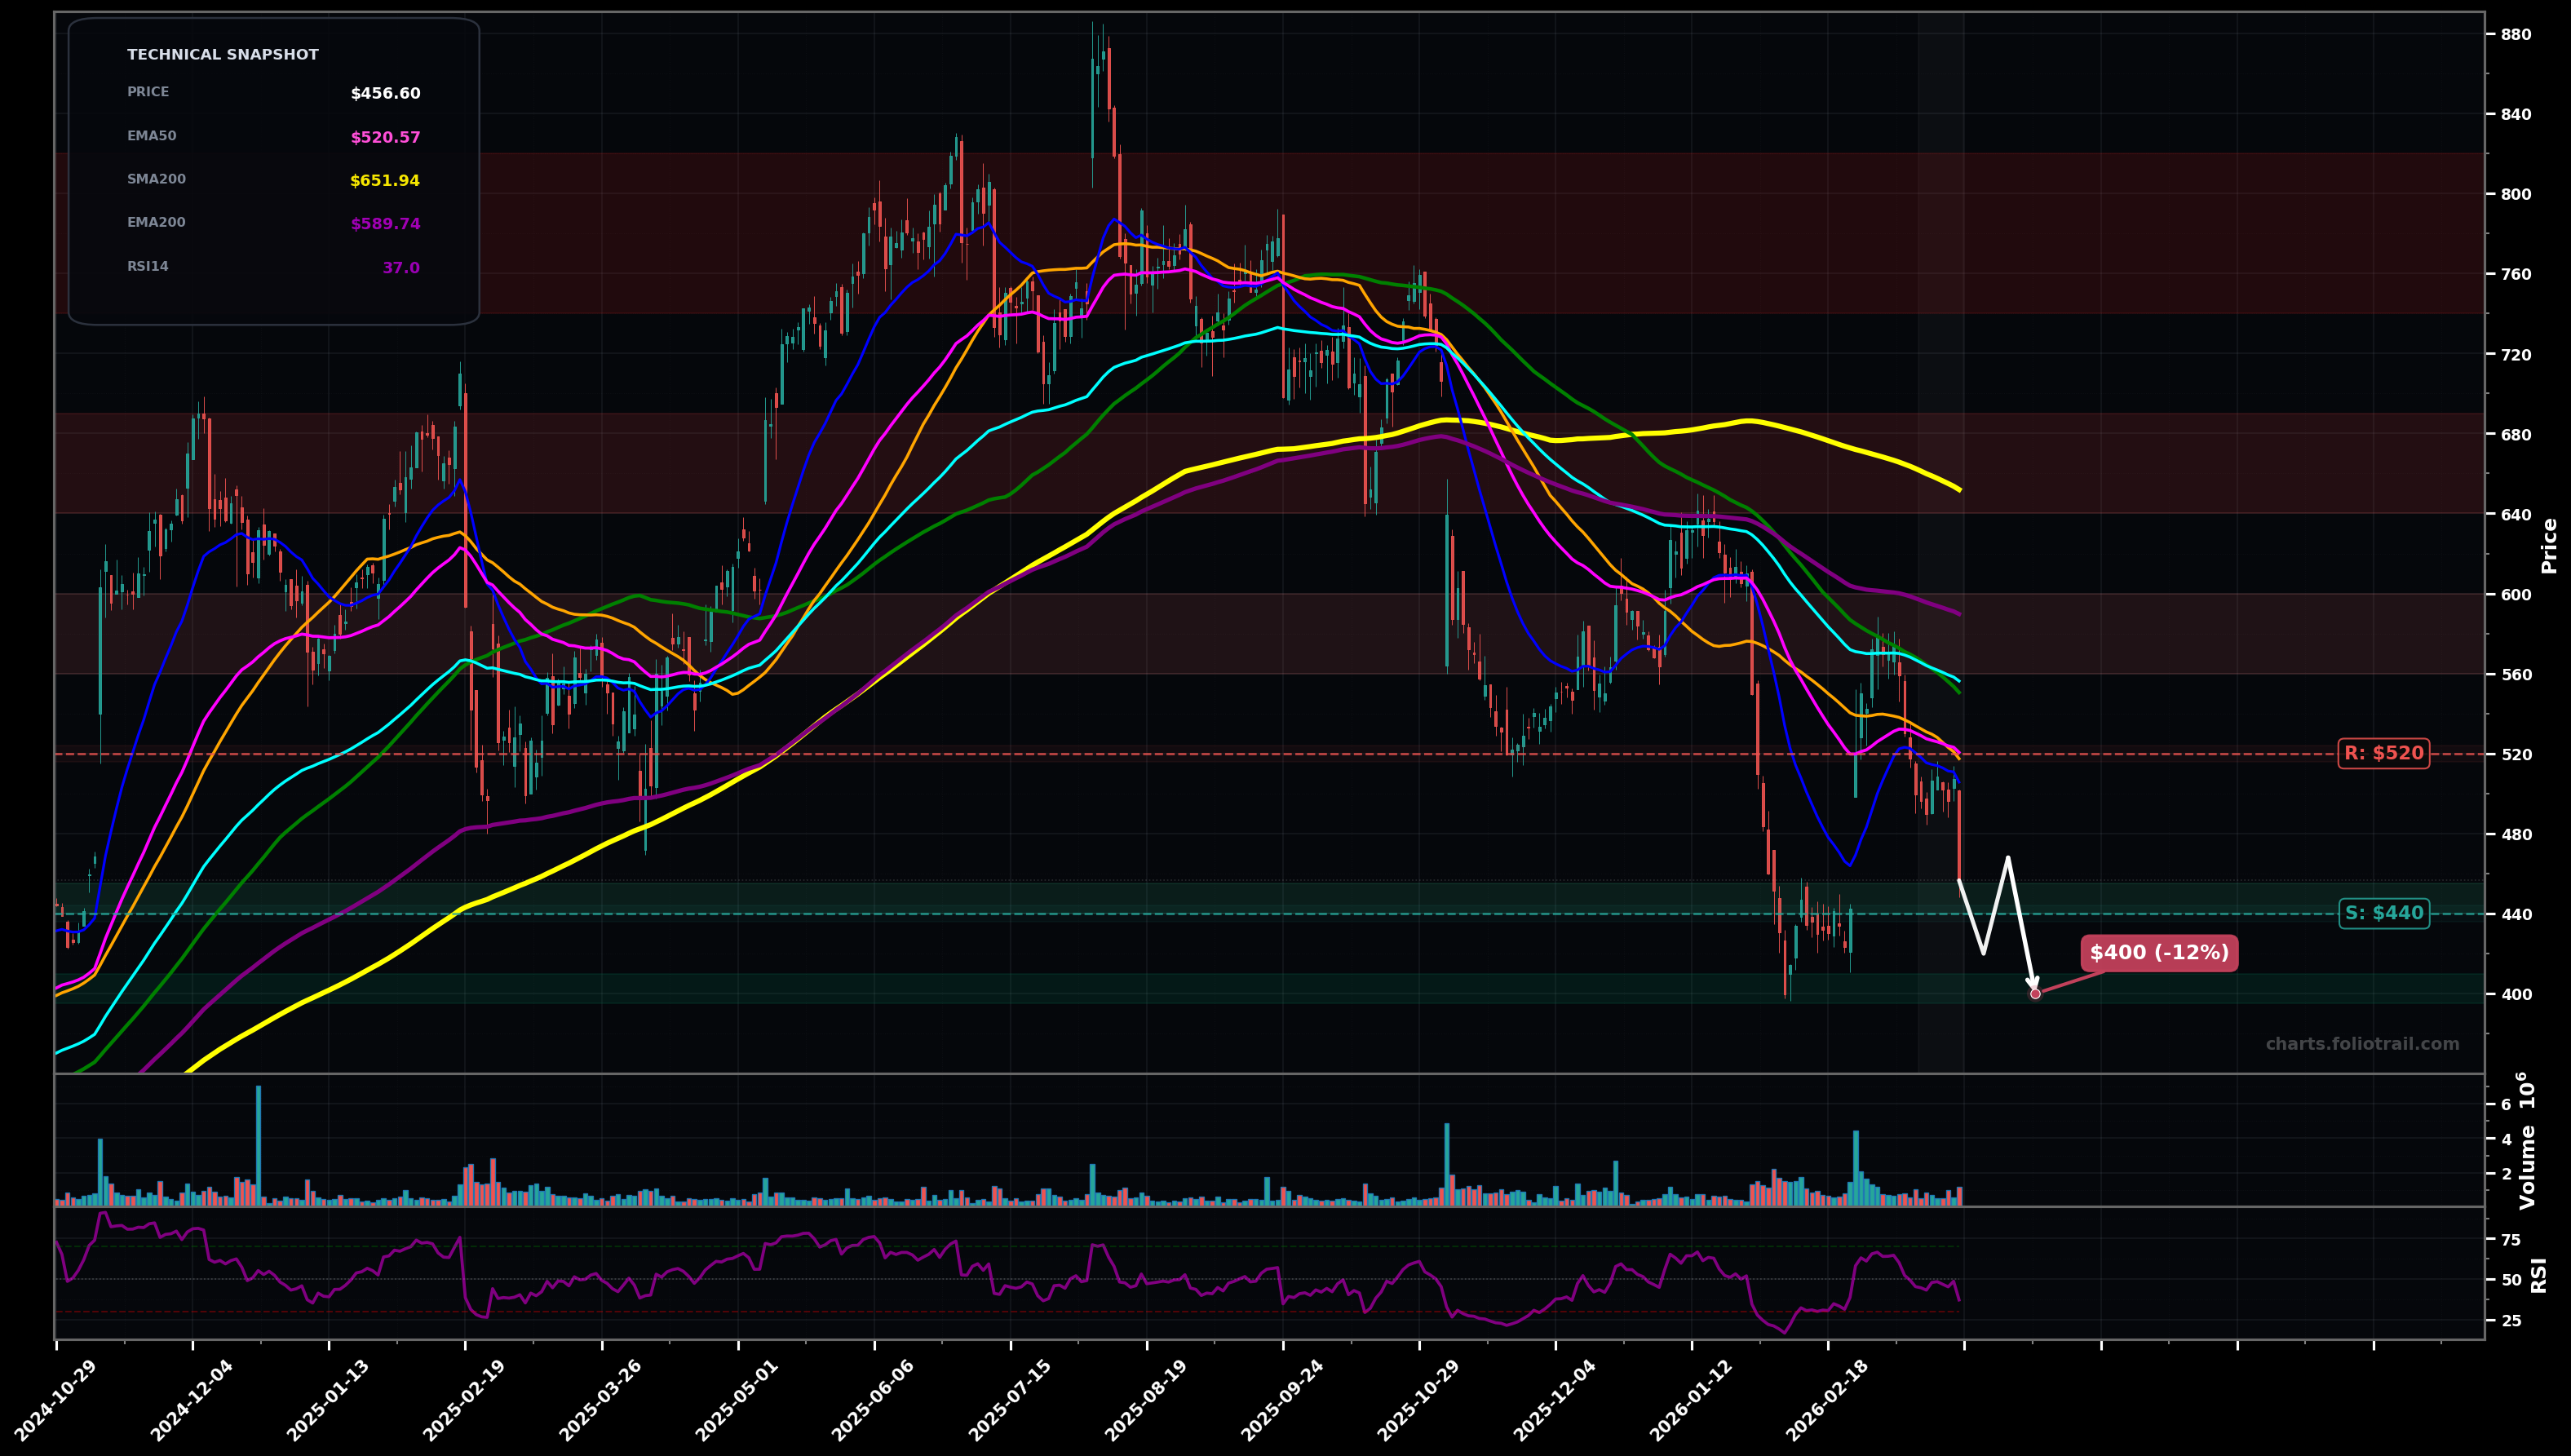
As of May 22, 2026, AXON (Axon Enterprise, Inc.) is in a downtrend state on the daily chart, with a confidence level of 74%. Key support is at $365 and key resistance at $420. Price at $385.83 is consolidating near the lows after a persistent LH/LL decline; trading below EMA50/EMA100 with EMA50 sloping down (RSI ~44).
Bearish continuation: weak bounce into declining EMA50/SMA50 zone, rejection, then breakdown to retest the recent swing-low area and potentially extend lower (Elliott: likely still in a larger Wave 3/5 down or a Wave C leg; current sideways action fits a bear-flag/Wave 4 pause before another push).
Counter-trend reversal attempt: hold above the recent swing low, reclaim EMA50 and then push into the heavier MA cluster overhead (Fibonacci-style retrace of the last selloff toward ~38.2%–50% region), turning the current base into a short-term BREAKOUT_REVERSAL if follow-through holds.
Daily close below $380 followed by continuation to a new LL (below ~$365) would confirm trend continuation
Two consecutive daily closes back above $420 would invalidate the immediate downtrend pressure and shift toward a reversal attempt
Start near prior pivot support ($365 area) with tight risk; add on a flush into next demand ($340); heavy add only if capitulation-style extension toward lower Fib/major round support ($320-$340) while watching for a reversal candle/HL.
Trim into overhead MA supply: EMA100/cluster first (~$465-$520), then SMA200/EMA200 zone (~$520-$575), and fully exit into the bigger long-term mean-reversion area near SMA200+ prior breakdown region (~$575-$680).
As of May 22, 2026, AXON (Axon Enterprise, Inc.) is in a downtrend state on the daily chart with 74% confidence. Price at $385.83 is consolidating near the lows after a persistent LH/LL decline; trading below EMA50/EMA100 with EMA50 sloping down (RSI ~44).
On the daily timeframe, AXON has key support at $365 and key resistance at $420. The most likely scenario (bearish) targets $365 and $340, with a revert level at $410.
AXON (Axon Enterprise, Inc.) is currently classified as downtrend on the daily chart, with 74% confidence. Confirmation requires: Daily close below $380 followed by continuation to a new LL (below ~$365) would confirm trend continuation This would be invalidated by: Two consecutive daily closes back above $420 would invalidate the immediate downtrend pressure and shift toward a reversal attempt
The most likely scenario (bearish) targets $365 and $340, with a revert level at $410. The alternative scenario (bullish) targets $420 and $465.
Multi-layer AI agents analyse 200+ stocks across daily, weekly, and monthly timeframes — producing market state classifications, price scenarios with targets, and position entry/exit levels. Daily charts updated every trading day at 6 PM ET. Weekly charts refresh Fridays. Monthly charts refresh on the last trading day of each month. No paywall. No sign-up required.
Built by Foliotrail.
All content on this website — including charts, analysis, price targets, support/resistance levels, and position zones — is generated entirely by AI and provided for educational and informational purposes only.
This is not financial advice. NEXUSNOIR VENTURES SL (the operator of this website) is not a registered investment adviser or broker-dealer. You should not make investment decisions based solely on this information. Always do your own research and consult a qualified financial advisor.
By continuing, you acknowledge that you have read and agree to our full disclaimer & terms of use and privacy policy.