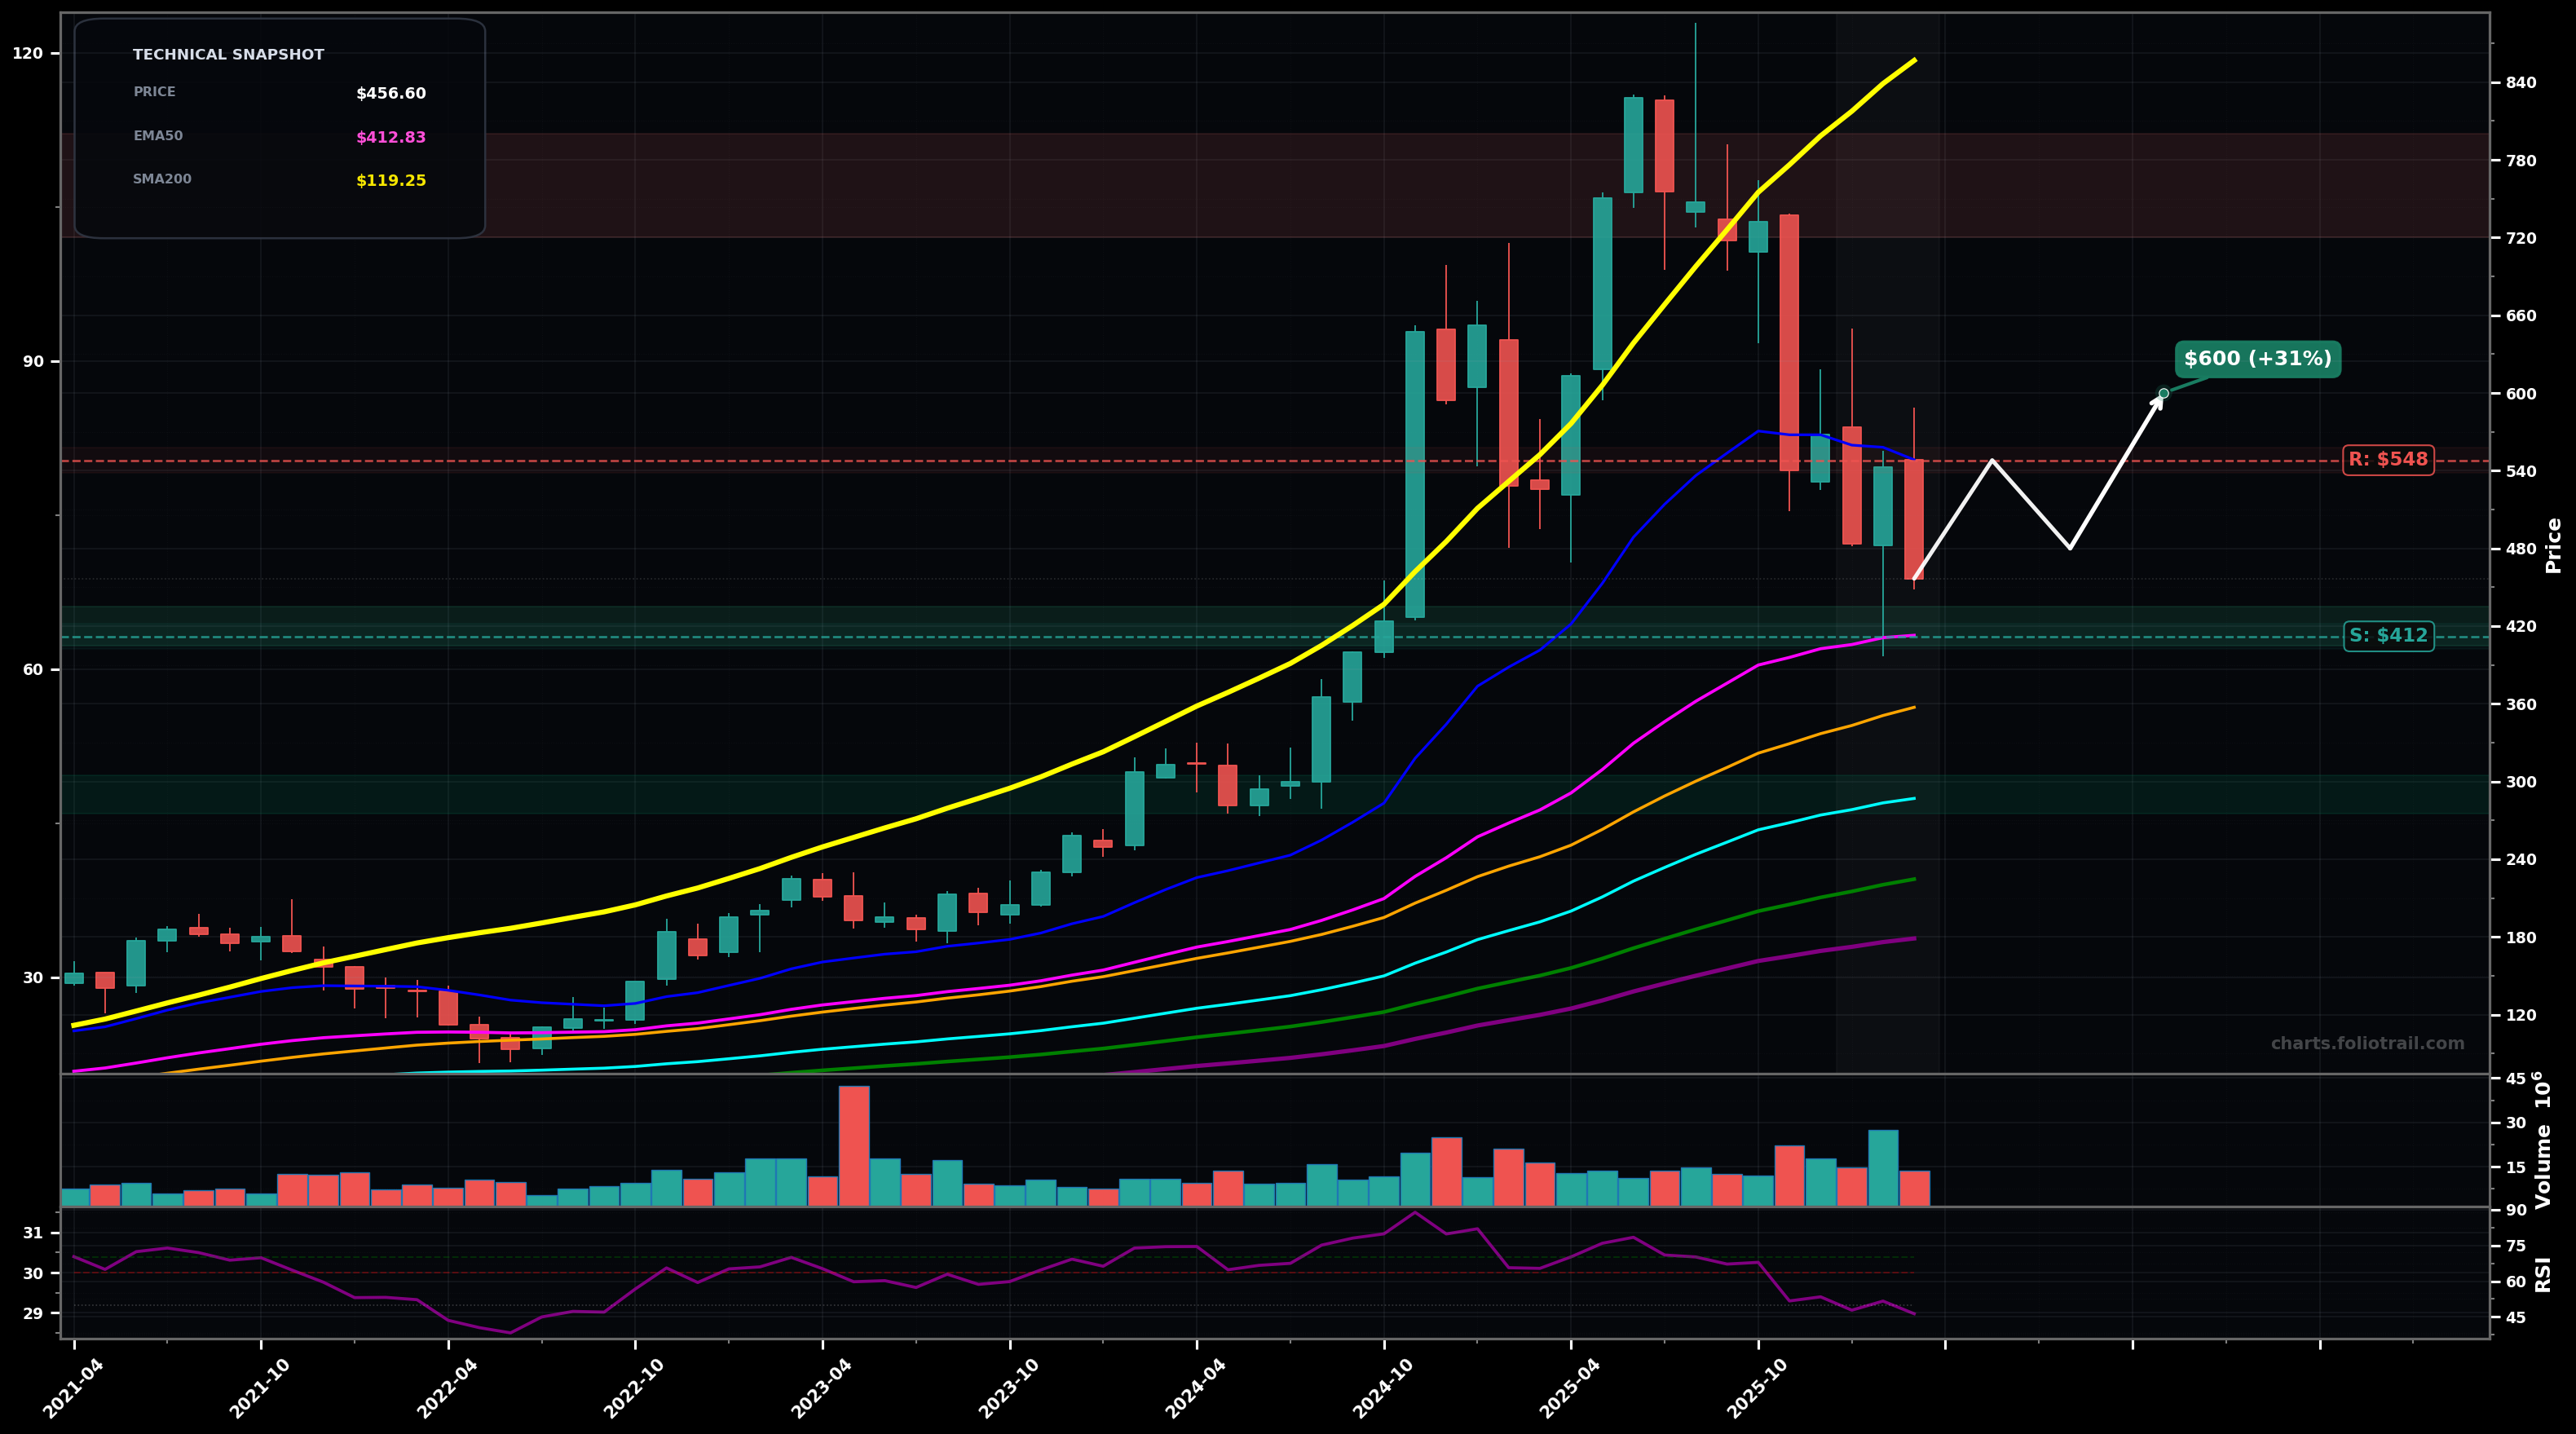
As of March 25, 2026, AXON (Axon Enterprise, Inc.) is in a bottoming attempt state on the monthly chart, with a confidence level of 56%. Key support is at $412 and key resistance at $548. Monthly pullback from the ~$800s peak into the mid-$400s with momentum cooling (RSI ~46) while still holding above rising longer-term MAs; price is below EMA50 (~$412) but well above EMA100/200.
Most likely: corrective bottom forms (Wave 4 / ABC) between ~$412-$480, then a rebound to retest the broken midline/EMA20 area; if that holds, price works higher into the prior supply band.
Second most likely: correction extends (deeper Wave 4) with a flush into the 0.382–0.50 Fibonacci retrace zone of the prior impulse; buyers defend the rising SMA50/EMA100 area before any meaningful bounce.
2+ monthly closes back above $548 (EMA20) and then a higher low above $480
Monthly close below $412 (EMA50) followed by a breakdown under $357 (SMA50)
Start near EMA50 support (~$412) if it stabilizes; add at SMA50 (~$357) which aligns with a common 0.382 retrace; heavy add near EMA100 (~$286) / ~0.50 retrace where a deeper Wave-4/ABC often ends.
Trim into prior monthly supply/peak region (~$720-$900); fully exit only if price becomes materially extended above the prior ATH zone (probable late-cycle Wave 5 extension).
As of March 25, 2026, AXON (Axon Enterprise, Inc.) is in a bottoming attempt state on the monthly chart with 56% confidence. Monthly pullback from the ~$800s peak into the mid-$400s with momentum cooling (RSI ~46) while still holding above rising longer-term MAs; price is below EMA50 (~$412) but well above EMA100/200.
On the monthly timeframe, AXON has key support at $412 and key resistance at $548. The most likely scenario (bullish) targets $548 and $600, with a revert level at $480.
AXON (Axon Enterprise, Inc.) is currently classified as bottoming attempt on the monthly chart, with 56% confidence. Confirmation requires: 2+ monthly closes back above $548 (EMA20) and then a higher low above $480 This would be invalidated by: Monthly close below $412 (EMA50) followed by a breakdown under $357 (SMA50)
The most likely scenario (bullish) targets $548 and $600, with a revert level at $480. The alternative scenario (bearish) targets $357 and $286.
Multi-layer AI agents analyse 200+ stocks across daily, weekly, and monthly timeframes — producing market state classifications, price scenarios with targets, and position entry/exit levels. Updated every trading day after market close. No paywall. No sign-up required.
Built by Foliotrail.
All content on this website — including charts, analysis, price targets, support/resistance levels, and position zones — is generated entirely by AI and provided for educational and informational purposes only.
This is not financial advice. NEXUSNOIR VENTURES SL (the operator of this website) is not a registered investment adviser or broker-dealer. You should not make investment decisions based solely on this information. Always do your own research and consult a qualified financial advisor.
By continuing, you acknowledge that you have read and agree to our full disclaimer & terms of use and privacy policy.