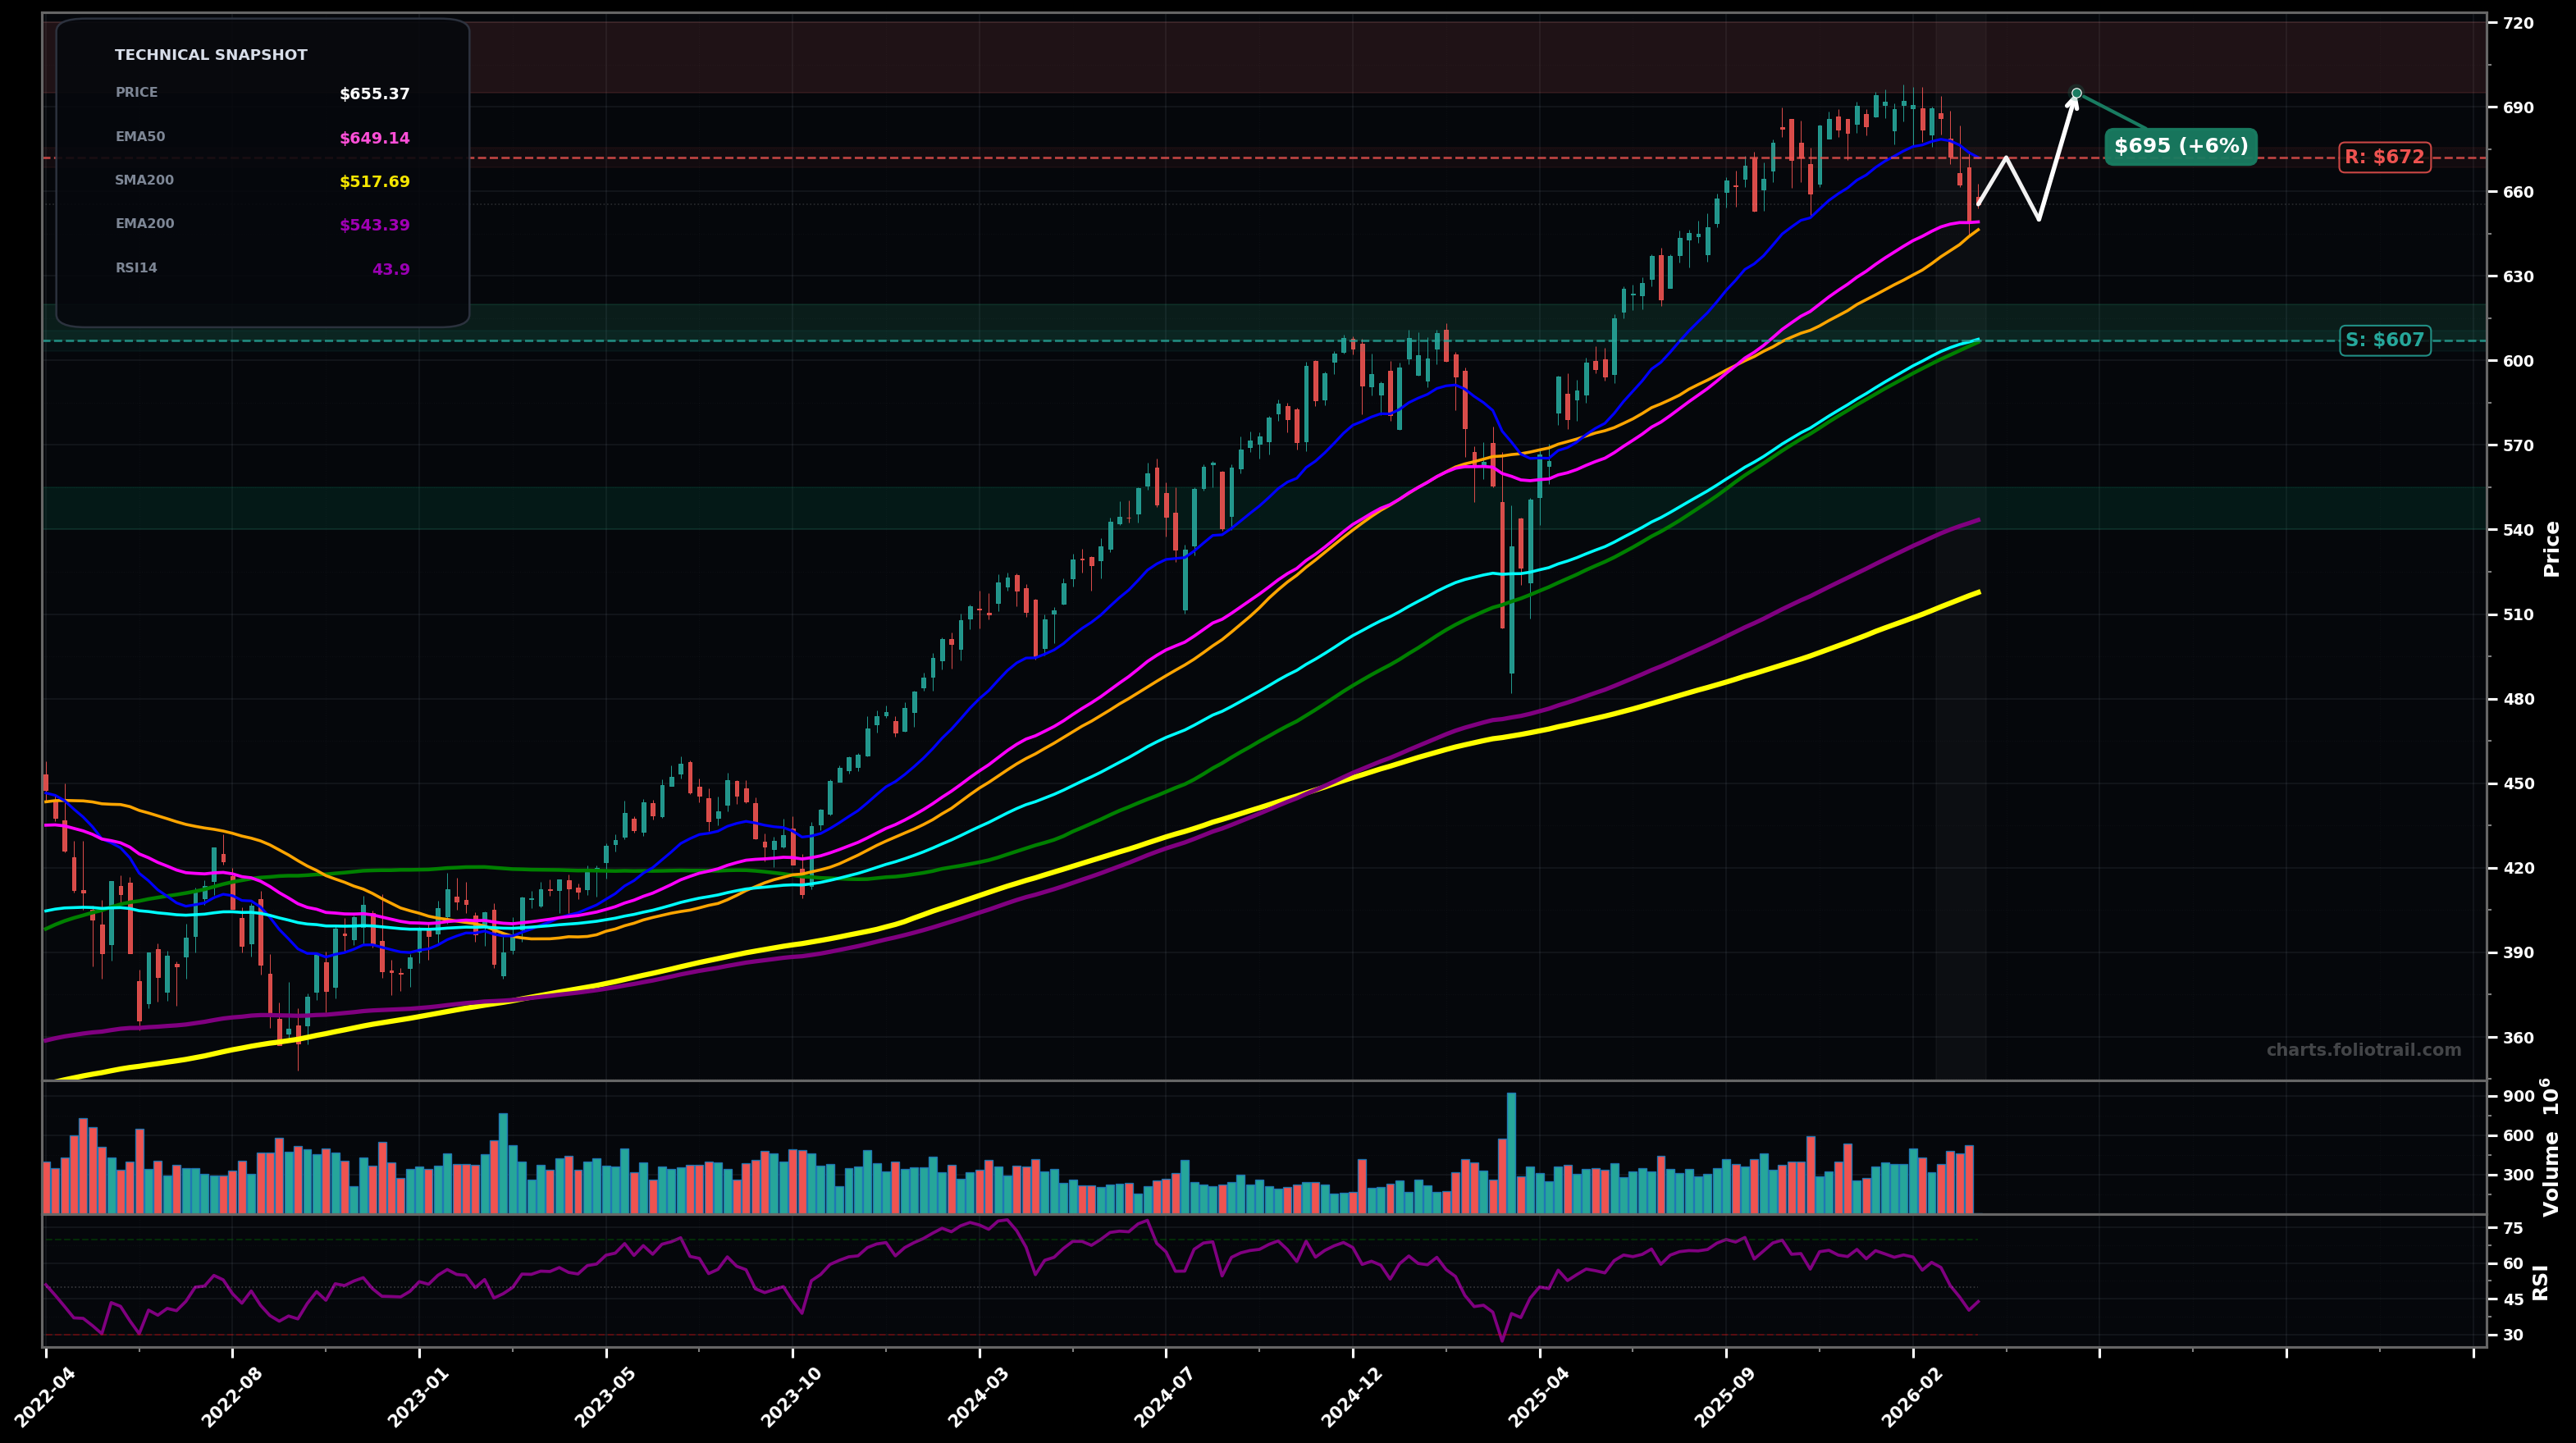
As of March 23, 2026, SPY (SPDR S&P 500 ETF Trust) is in a uptrend state on the weekly chart, with a confidence level of 63%. Key support is at $607 and key resistance at $672. Weekly pullback from recent highs; price lost the fast EMA stack and is sitting near the $650 area with RSI cooling (~44).
Bullish continuation: pullback holds the $650-$607 confluence (EMA50/SMA50 then EMA100), then rebounds to retest prior highs; consistent with an Elliott Wave-style Wave 4 pullback followed by a Wave 5 attempt.
Deeper corrective leg: loss of $650 leads to a full mean-reversion into EMA100 (~$607) and potentially EMA200 (~$543); would fit a larger ABC correction where C extends on risk-off flow.
2+ weekly closes back above $672 (reclaim EMA20 area) would confirm trend resumption
Weekly close below $607 (EMA100) would invalidate the clean uptrend state and shift bias to correction/downtrend
Buy-the-dip zones are anchored to EMA100 first (trend support), then a deeper retrace toward prior structure/mean reversion with EMA200 as the high-confluence ‘line in the sand’.
Trim into strength as price becomes increasingly stretched above rising EMA50/EMA100 (late-cycle Wave 5 / extension risk), with heavier trims at new extension highs where reversal risk rises.
As of March 23, 2026, SPY (SPDR S&P 500 ETF Trust) is in a uptrend state on the weekly chart with 63% confidence. Weekly pullback from recent highs; price lost the fast EMA stack and is sitting near the $650 area with RSI cooling (~44).
On the weekly timeframe, SPY has key support at $607 and key resistance at $672. The most likely scenario (bullish) targets $672 and $695, with a revert level at $650.
SPY (SPDR S&P 500 ETF Trust) is currently classified as uptrend on the weekly chart, with 63% confidence. Confirmation requires: 2+ weekly closes back above $672 (reclaim EMA20 area) would confirm trend resumption This would be invalidated by: Weekly close below $607 (EMA100) would invalidate the clean uptrend state and shift bias to correction/downtrend
The most likely scenario (bullish) targets $672 and $695, with a revert level at $650. The alternative scenario (bearish) targets $607 and $543.
All content on this website — including charts, analysis, price targets, support/resistance levels, and position zones — is generated entirely by AI and provided for educational and informational purposes only.
This is not financial advice. NEXUSNOIR VENTURES SL (the operator of this website) is not a registered investment adviser or broker-dealer. You should not make investment decisions based solely on this information. Always do your own research and consult a qualified financial advisor.
By continuing, you acknowledge that you have read and agree to our full disclaimer & terms of use and privacy policy.