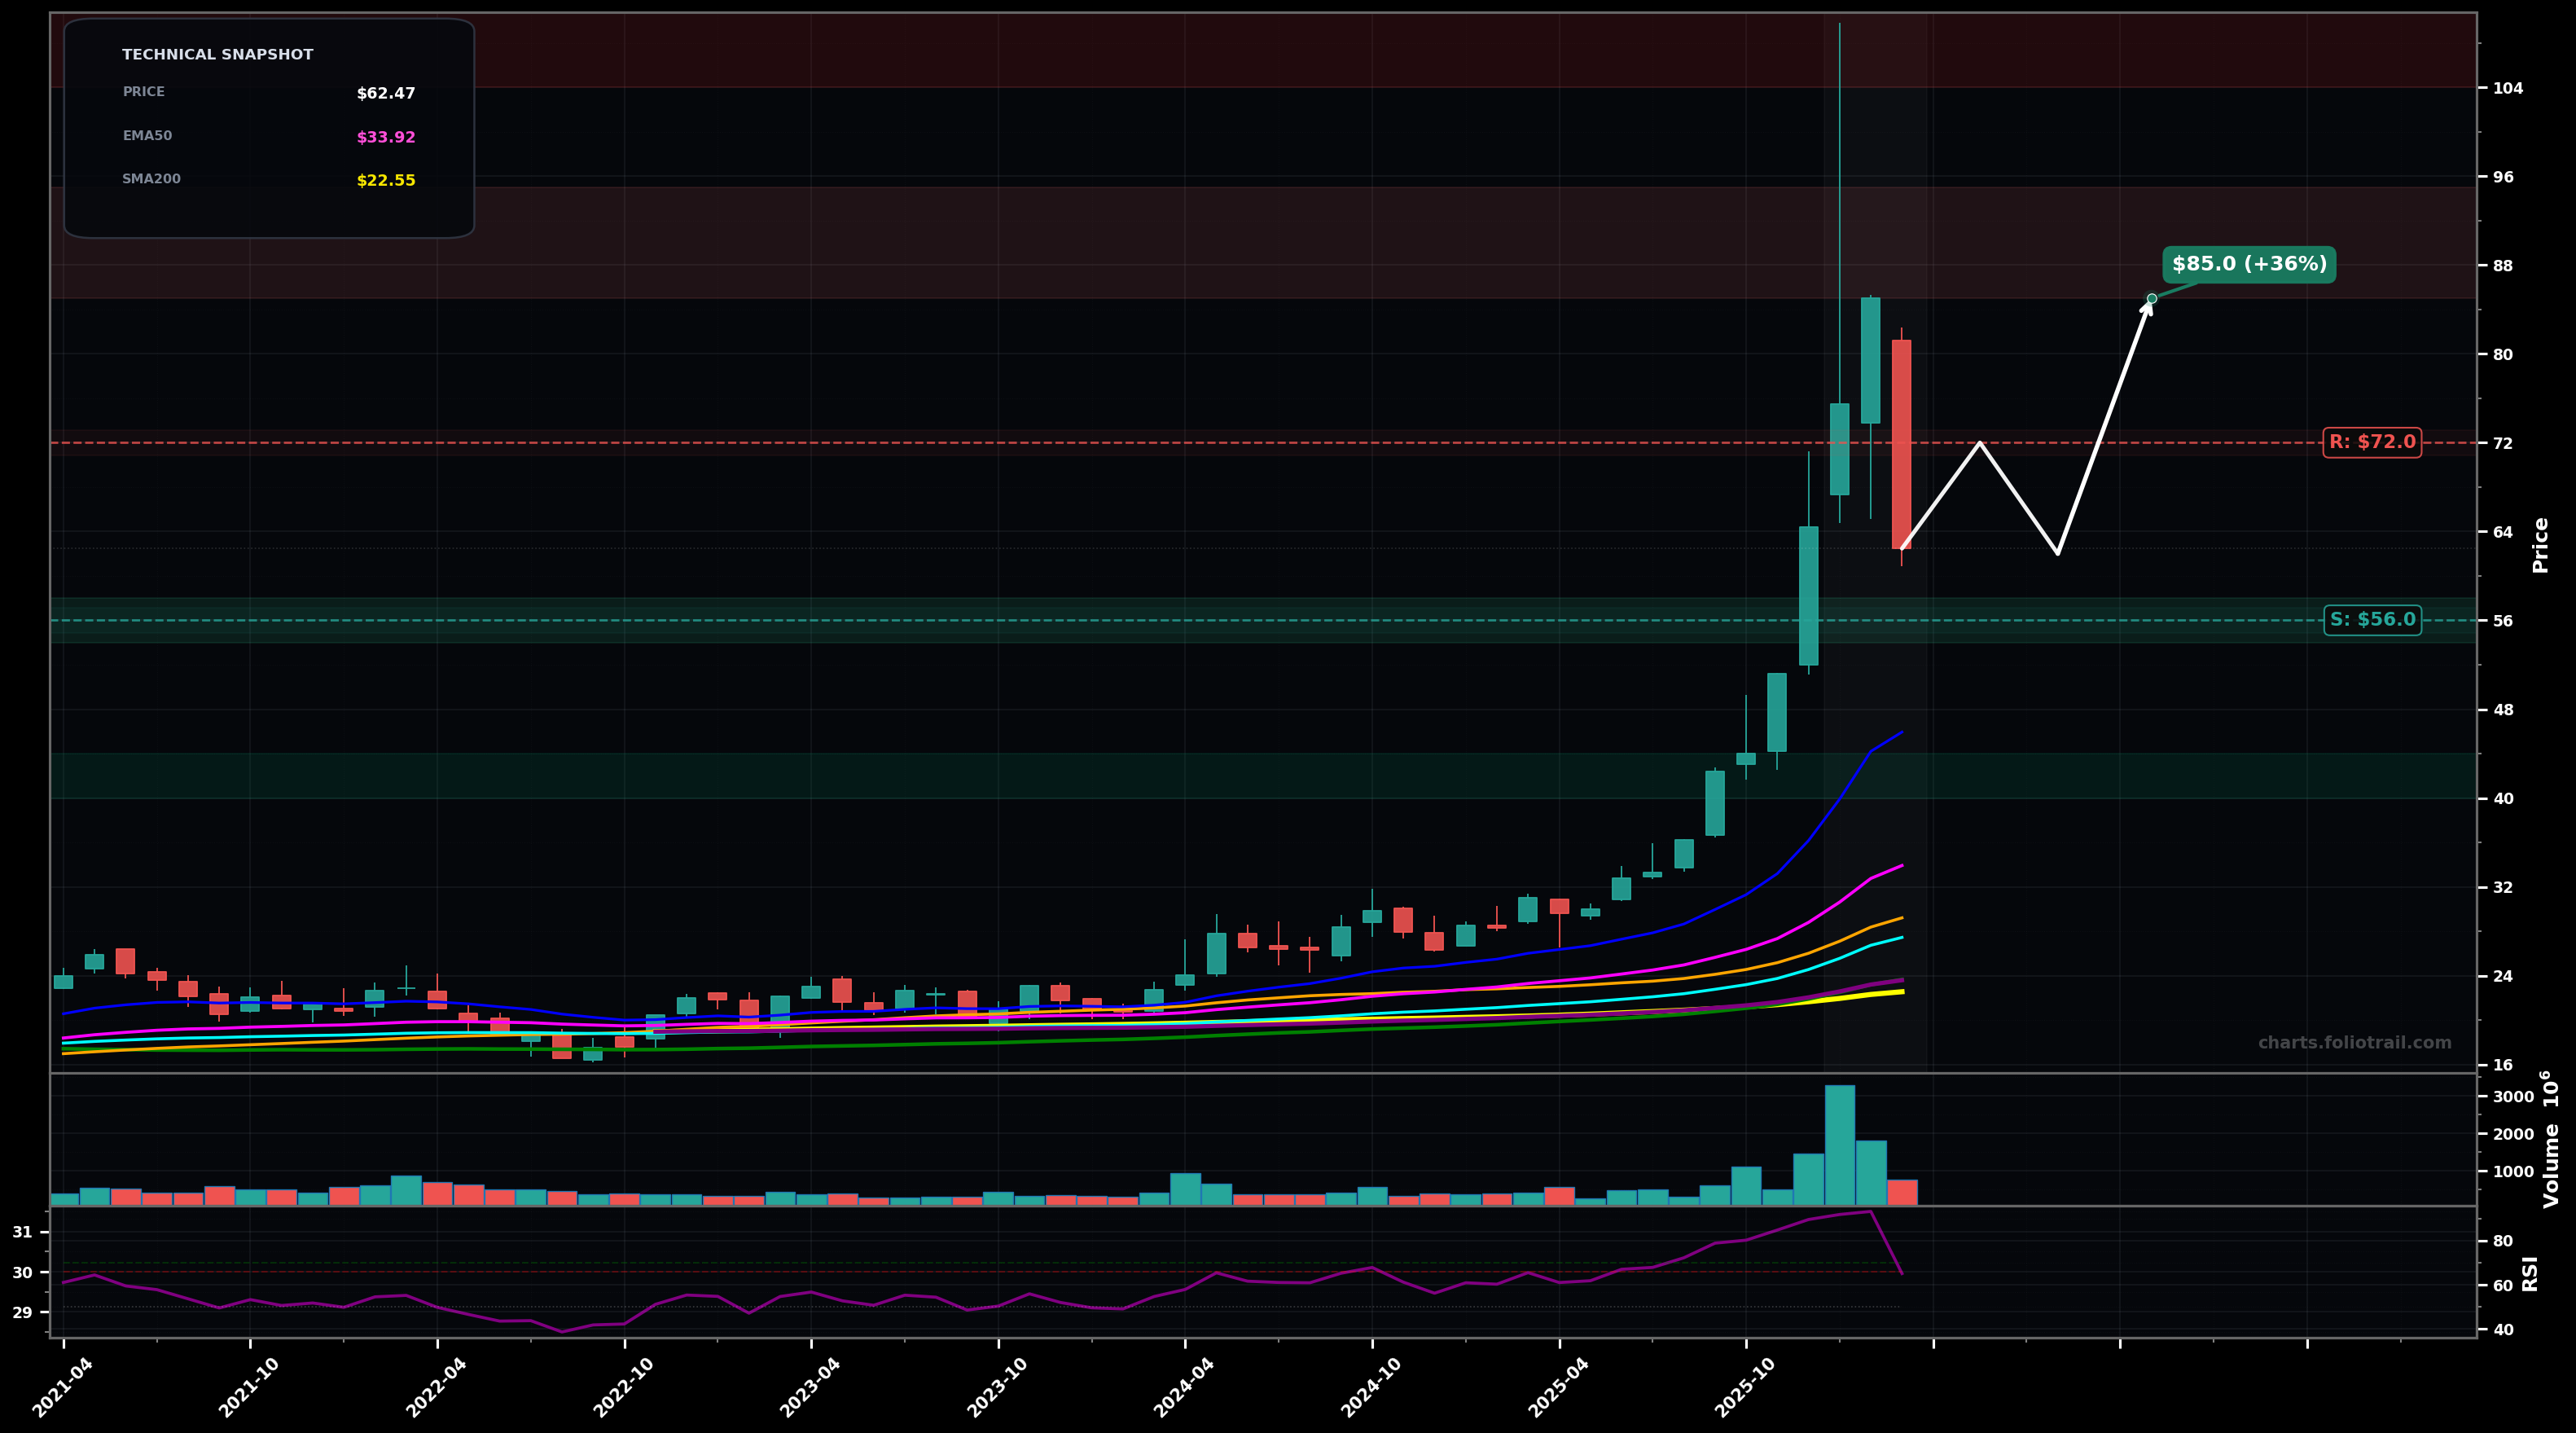
As of March 23, 2026, SLV (iShares Silver Trust) is in a volatility expansion state on the monthly chart, with a confidence level of 72%. Key support is at $56.0 and key resistance at $72.0. Monthly impulsive rally to ~$85 followed by sharp pullback; still holding well above rising fast EMAs with elevated volume and RSI cooling (~65).
Bullish consolidation: hold the ~$56 swing-support zone (prior breakout area) and build a higher low, then attempt a retest of the ~$72 pivot and potentially the ~$85 high (Elliott: Wave 4 pullback then Wave 5 retest/high extension).
Deeper corrective flush: price fails to hold ~$56 and mean-reverts toward the fast MA cluster; likely a larger ABC correction that targets the ~$50 psychological/structure zone first, with risk down toward ~$42 (approx prior breakout shelf / fib retrace region).
Further volatility expansion confirmed on a monthly close outside $56–$85 (either direction).
Volatility-expansion call weakens if price compresses and holds between $60–$70 for 3+ monthly closes.
Buy-the-dip tiers mapped to (1) reclaim/hold of the ~$56 swing low reference, (2) deeper fib/structure retrace near ~$50, (3) larger ABC completion/mean reversion nearer ~$42–$44 while staying above long MAs (SMA200 ~$22.55).
Trim into prior blow-off zone and measured-extension resistance: ~$85 is the first major supply; above ~$95–$104 implies stretched extensions vs EMA50/EMA100 and higher odds of a multi-month mean reversion.
As of March 23, 2026, SLV (iShares Silver Trust) is in a volatility expansion state on the monthly chart with 72% confidence. Monthly impulsive rally to ~$85 followed by sharp pullback; still holding well above rising fast EMAs with elevated volume and RSI cooling (~65).
On the monthly timeframe, SLV has key support at $56.0 and key resistance at $72.0. The most likely scenario (bullish) targets $72.0 and $85.0, with a revert level at $62.0.
SLV (iShares Silver Trust) is currently classified as volatility expansion on the monthly chart, with 72% confidence. Confirmation requires: Further volatility expansion confirmed on a monthly close outside $56–$85 (either direction). This would be invalidated by: Volatility-expansion call weakens if price compresses and holds between $60–$70 for 3+ monthly closes.
The most likely scenario (bullish) targets $72.0 and $85.0, with a revert level at $62.0. The alternative scenario (bearish) targets $50.0 and $42.0.
All content on this website — including charts, analysis, price targets, support/resistance levels, and position zones — is generated entirely by AI and provided for educational and informational purposes only.
This is not financial advice. NEXUSNOIR VENTURES SL (the operator of this website) is not a registered investment adviser or broker-dealer. You should not make investment decisions based solely on this information. Always do your own research and consult a qualified financial advisor.
By continuing, you acknowledge that you have read and agree to our full disclaimer & terms of use and privacy policy.