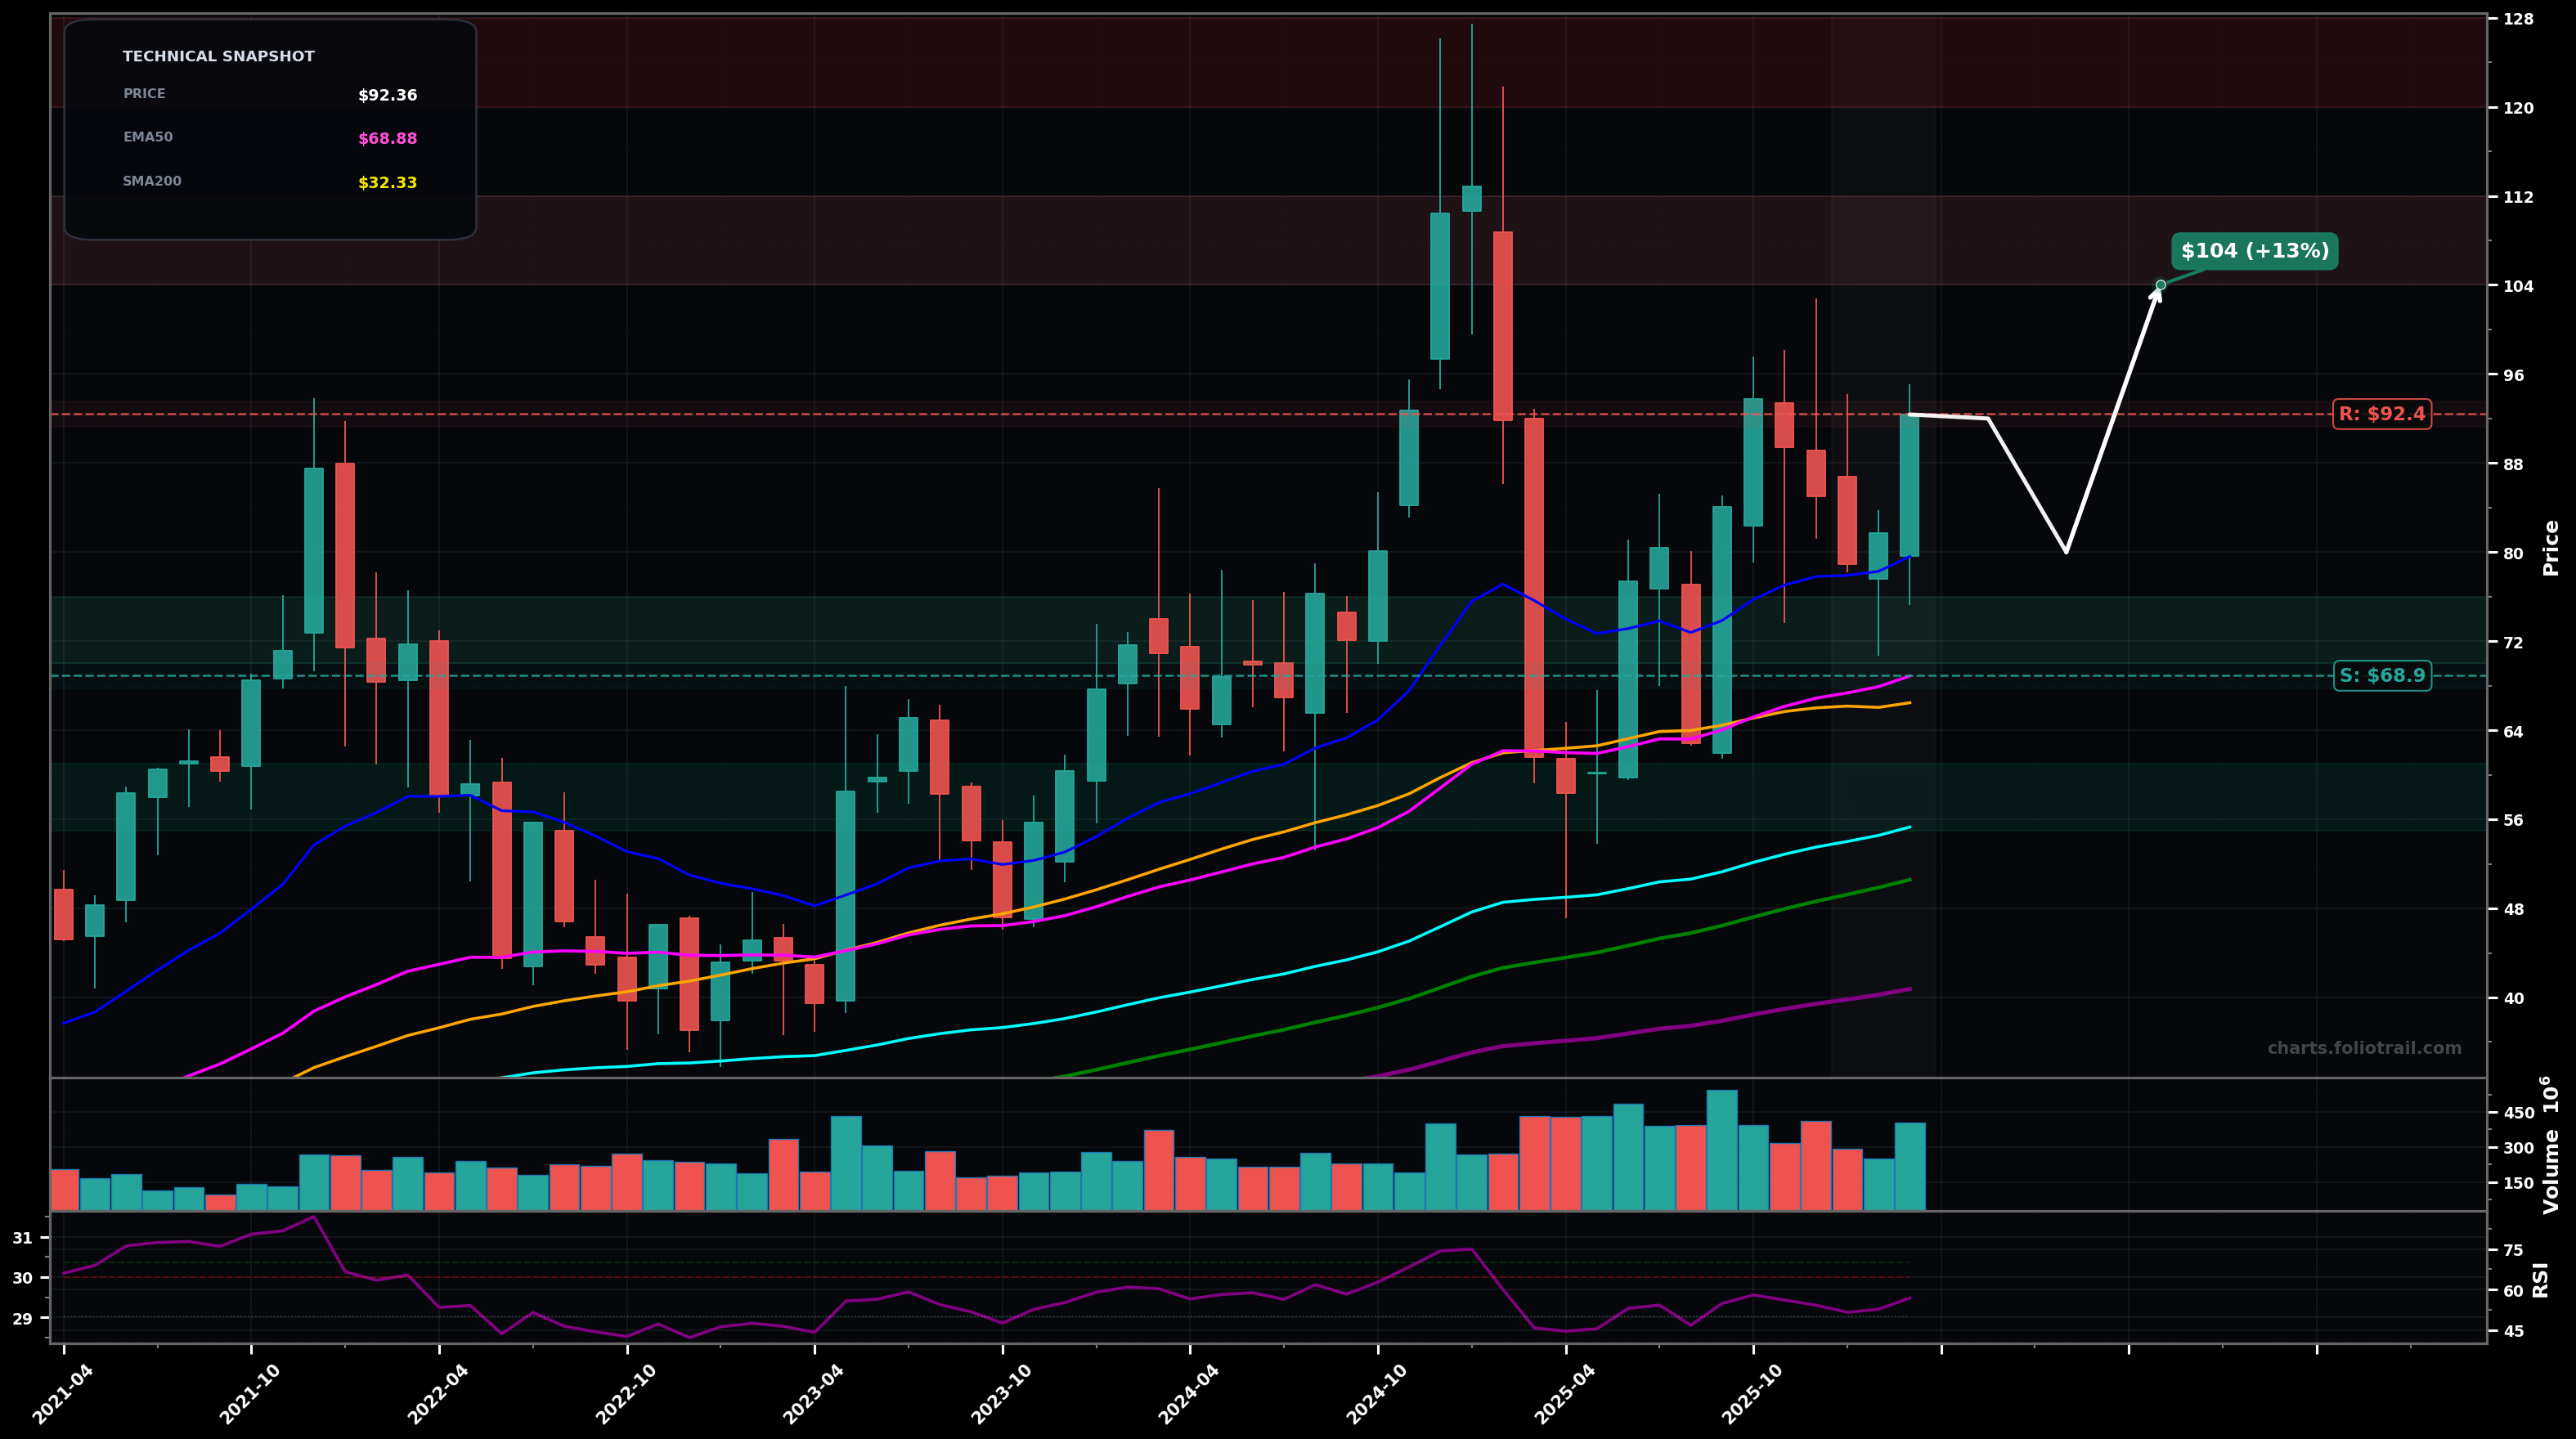
As of March 25, 2026, MRVL (Marvell Technology, Inc.) is in a choppy range state on the monthly chart, with a confidence level of 63%. Key support is at $68.9 and key resistance at $92.4. Monthly price is holding above the fast MAs after a sharp spike-and-dump from the ~$120s; recent candles show a rebound off the ~$60s with price back in the low-$80s and RSI ~57.
Range continuation with a bullish tilt: price holds the EMA50/SMA50 band (~$69-$66) and grinds higher to retest the post-peak supply zone; Elliott Wave read: possible start of a new impulse from the ~$60 swing low (wave 1/2 developing), with a push into wave 3 if $92 breaks; Fibonacci: reclaiming the 0.5-0.618 retrace of the drop keeps upside odds elevated.
Bearish resolution: failure at ~$92 followed by a breakdown under the EMA50 (~$69) triggers a move back toward the mid-$60s then the prior base/mean-reversion magnets (SMA100/EMA100 zone and below); Elliott Wave read: the bounce was corrective (ABC) inside a larger post-peak correction; Fibonacci: losing the ~0.618 retrace of the bounce opens a retest of the prior swing low.
2+ monthly closes above $92 with a break of the recent swing high would confirm a bullish range resolution
A monthly close below $68 (loss of the EMA50 zone) would invalidate the range-to-upside bias and shift toward a bearish breakdown
Start near the EMA50/SMA50 confluence (~$69-$66); add on a deeper retrace to the prior pivot/base; heavy add near EMA100 (~$55) where long-term trend support typically attracts buyers if the correction extends.
Trim into prior supply from the blow-off region (former peak area) where volatility and rejection previously appeared; full close if price revisits/exceeds the prior extreme zone ($120+), implying stretched multiples vs long MAs and elevated reversal risk.
As of March 25, 2026, MRVL (Marvell Technology, Inc.) is in a choppy range state on the monthly chart with 63% confidence. Monthly price is holding above the fast MAs after a sharp spike-and-dump from the ~$120s; recent candles show a rebound off the ~$60s with price back in the low-$80s and RSI ~57.
On the monthly timeframe, MRVL has key support at $68.9 and key resistance at $92.4. The most likely scenario (bullish) targets $92.0 and $104, with a revert level at $80.0.
MRVL (Marvell Technology, Inc.) is currently classified as choppy range on the monthly chart, with 63% confidence. Confirmation requires: 2+ monthly closes above $92 with a break of the recent swing high would confirm a bullish range resolution This would be invalidated by: A monthly close below $68 (loss of the EMA50 zone) would invalidate the range-to-upside bias and shift toward a bearish breakdown
The most likely scenario (bullish) targets $92.0 and $104, with a revert level at $80.0. The alternative scenario (bearish) targets $63.5 and $55.3.
Multi-layer AI agents analyse 200+ stocks across daily, weekly, and monthly timeframes — producing market state classifications, price scenarios with targets, and position entry/exit levels. Updated every trading day after market close. No paywall. No sign-up required.
Built by Foliotrail.
All content on this website — including charts, analysis, price targets, support/resistance levels, and position zones — is generated entirely by AI and provided for educational and informational purposes only.
This is not financial advice. NEXUSNOIR VENTURES SL (the operator of this website) is not a registered investment adviser or broker-dealer. You should not make investment decisions based solely on this information. Always do your own research and consult a qualified financial advisor.
By continuing, you acknowledge that you have read and agree to our full disclaimer & terms of use and privacy policy.