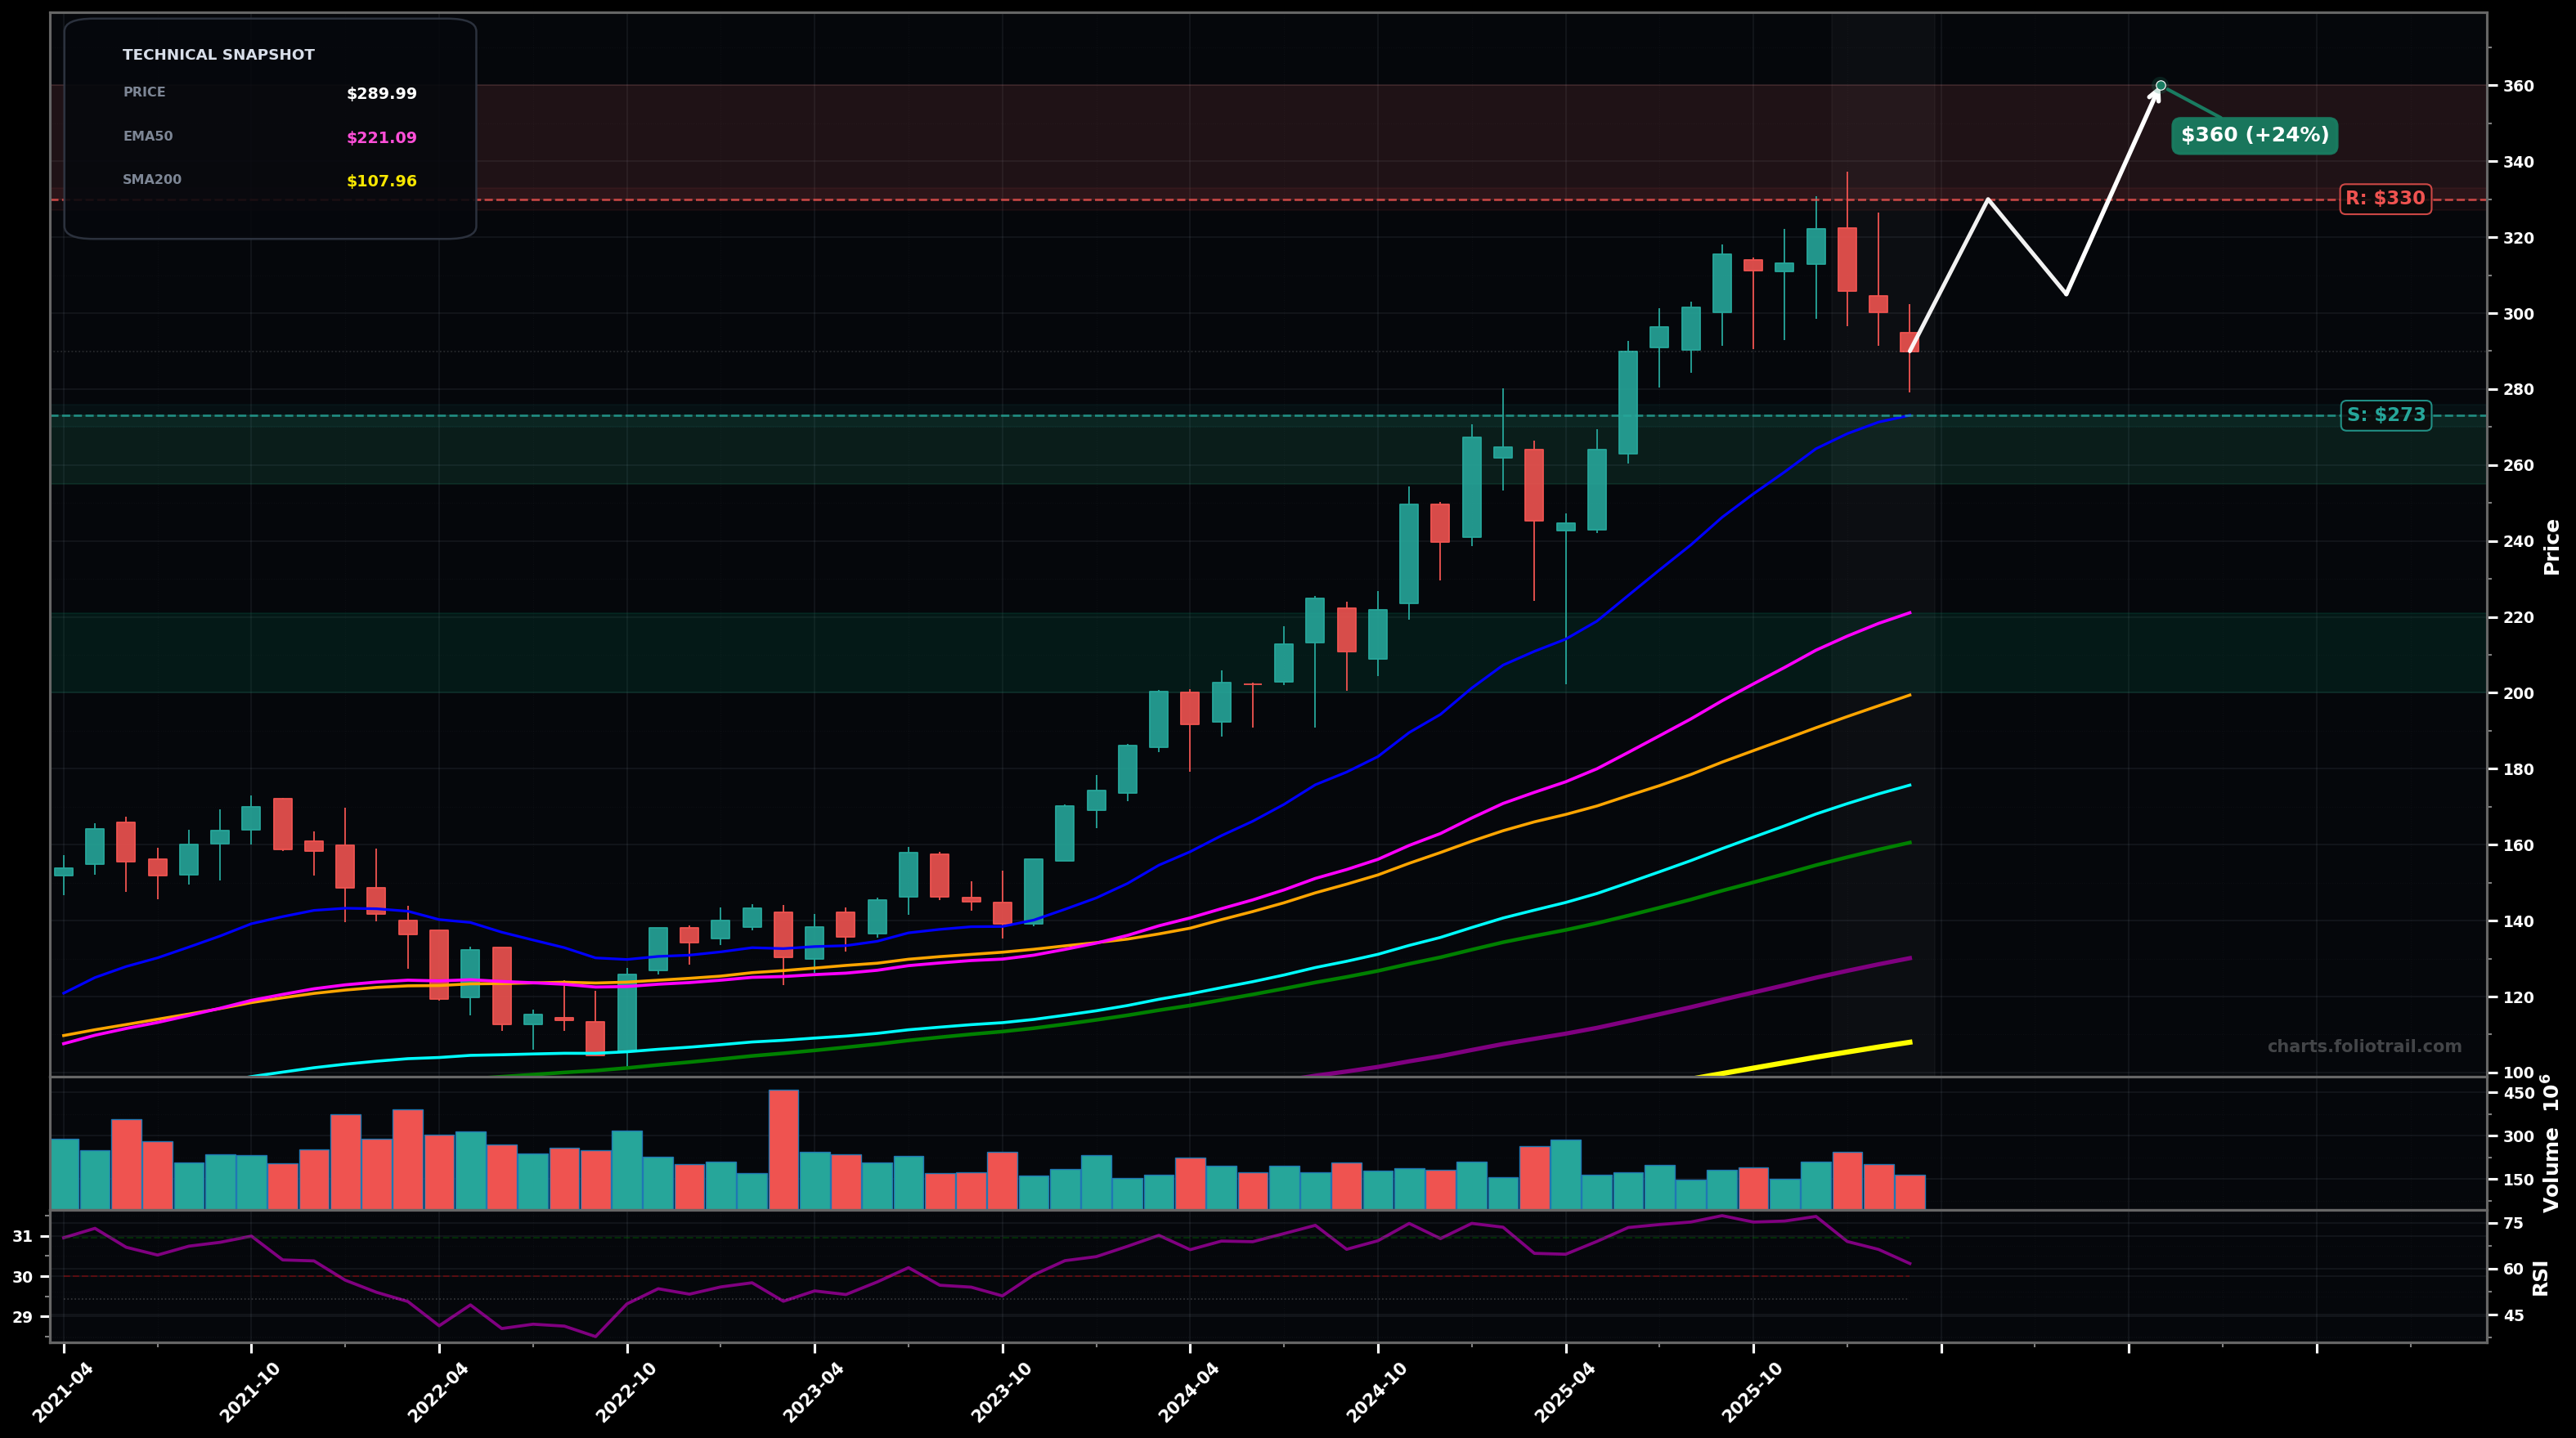
As of March 23, 2026, JPM (JPMorgan Chase & Co.) is in a uptrend state on the monthly chart, with a confidence level of 72%. Key support is at $273 and key resistance at $330. Monthly uptrend paused after a push to ~$330; last 3 candles are a pullback from the highs with RSI cooling (~62) while price remains well above rising EMA50.
Bullish continuation: current pullback acts as Wave 4 (Elliott) consolidation, then Wave 5 attempts a retest/extension above the prior high; Fibonacci extension from the prior impulse suggests a measured push toward the mid-$300s if $305 is reclaimed.
Deeper corrective phase: the drop from ~$330 develops into an ABC correction with a sweep under the $273 area; price mean-reverts toward the rising EMA50 zone before buyers defend the primary trend.
Monthly close back above $305 (reclaim prior breakdown area) would confirm trend continuation
Monthly close below $273 (loss of EMA20 / prior pivot zone) would invalidate the clean continuation setup
Buy zones are layered at the monthly swing-low reference/EMA20 area ($255-$273), then the stronger trend support at rising EMA50 (~$221), with a final buffer into the prior consolidation/round-number support (~$200).
Trim into retest/extension above the ~$330 high (Wave 5 / fib-extension area), increase trimming as price stretches further above EMA50/EMA100, and consider full exit only in an extreme extension regime where monthly price is significantly detached from the moving-average stack.
As of March 23, 2026, JPM (JPMorgan Chase & Co.) is in a uptrend state on the monthly chart with 72% confidence. Monthly uptrend paused after a push to ~$330; last 3 candles are a pullback from the highs with RSI cooling (~62) while price remains well above rising EMA50.
On the monthly timeframe, JPM has key support at $273 and key resistance at $330. The most likely scenario (bullish) targets $330 and $360, with a revert level at $305.
JPM (JPMorgan Chase & Co.) is currently classified as uptrend on the monthly chart, with 72% confidence. Confirmation requires: Monthly close back above $305 (reclaim prior breakdown area) would confirm trend continuation This would be invalidated by: Monthly close below $273 (loss of EMA20 / prior pivot zone) would invalidate the clean continuation setup
The most likely scenario (bullish) targets $330 and $360, with a revert level at $305. The alternative scenario (bearish) targets $255 and $221.
All content on this website — including charts, analysis, price targets, support/resistance levels, and position zones — is generated entirely by AI and provided for educational and informational purposes only.
This is not financial advice. NEXUSNOIR VENTURES SL (the operator of this website) is not a registered investment adviser or broker-dealer. You should not make investment decisions based solely on this information. Always do your own research and consult a qualified financial advisor.
By continuing, you acknowledge that you have read and agree to our full disclaimer & terms of use and privacy policy.