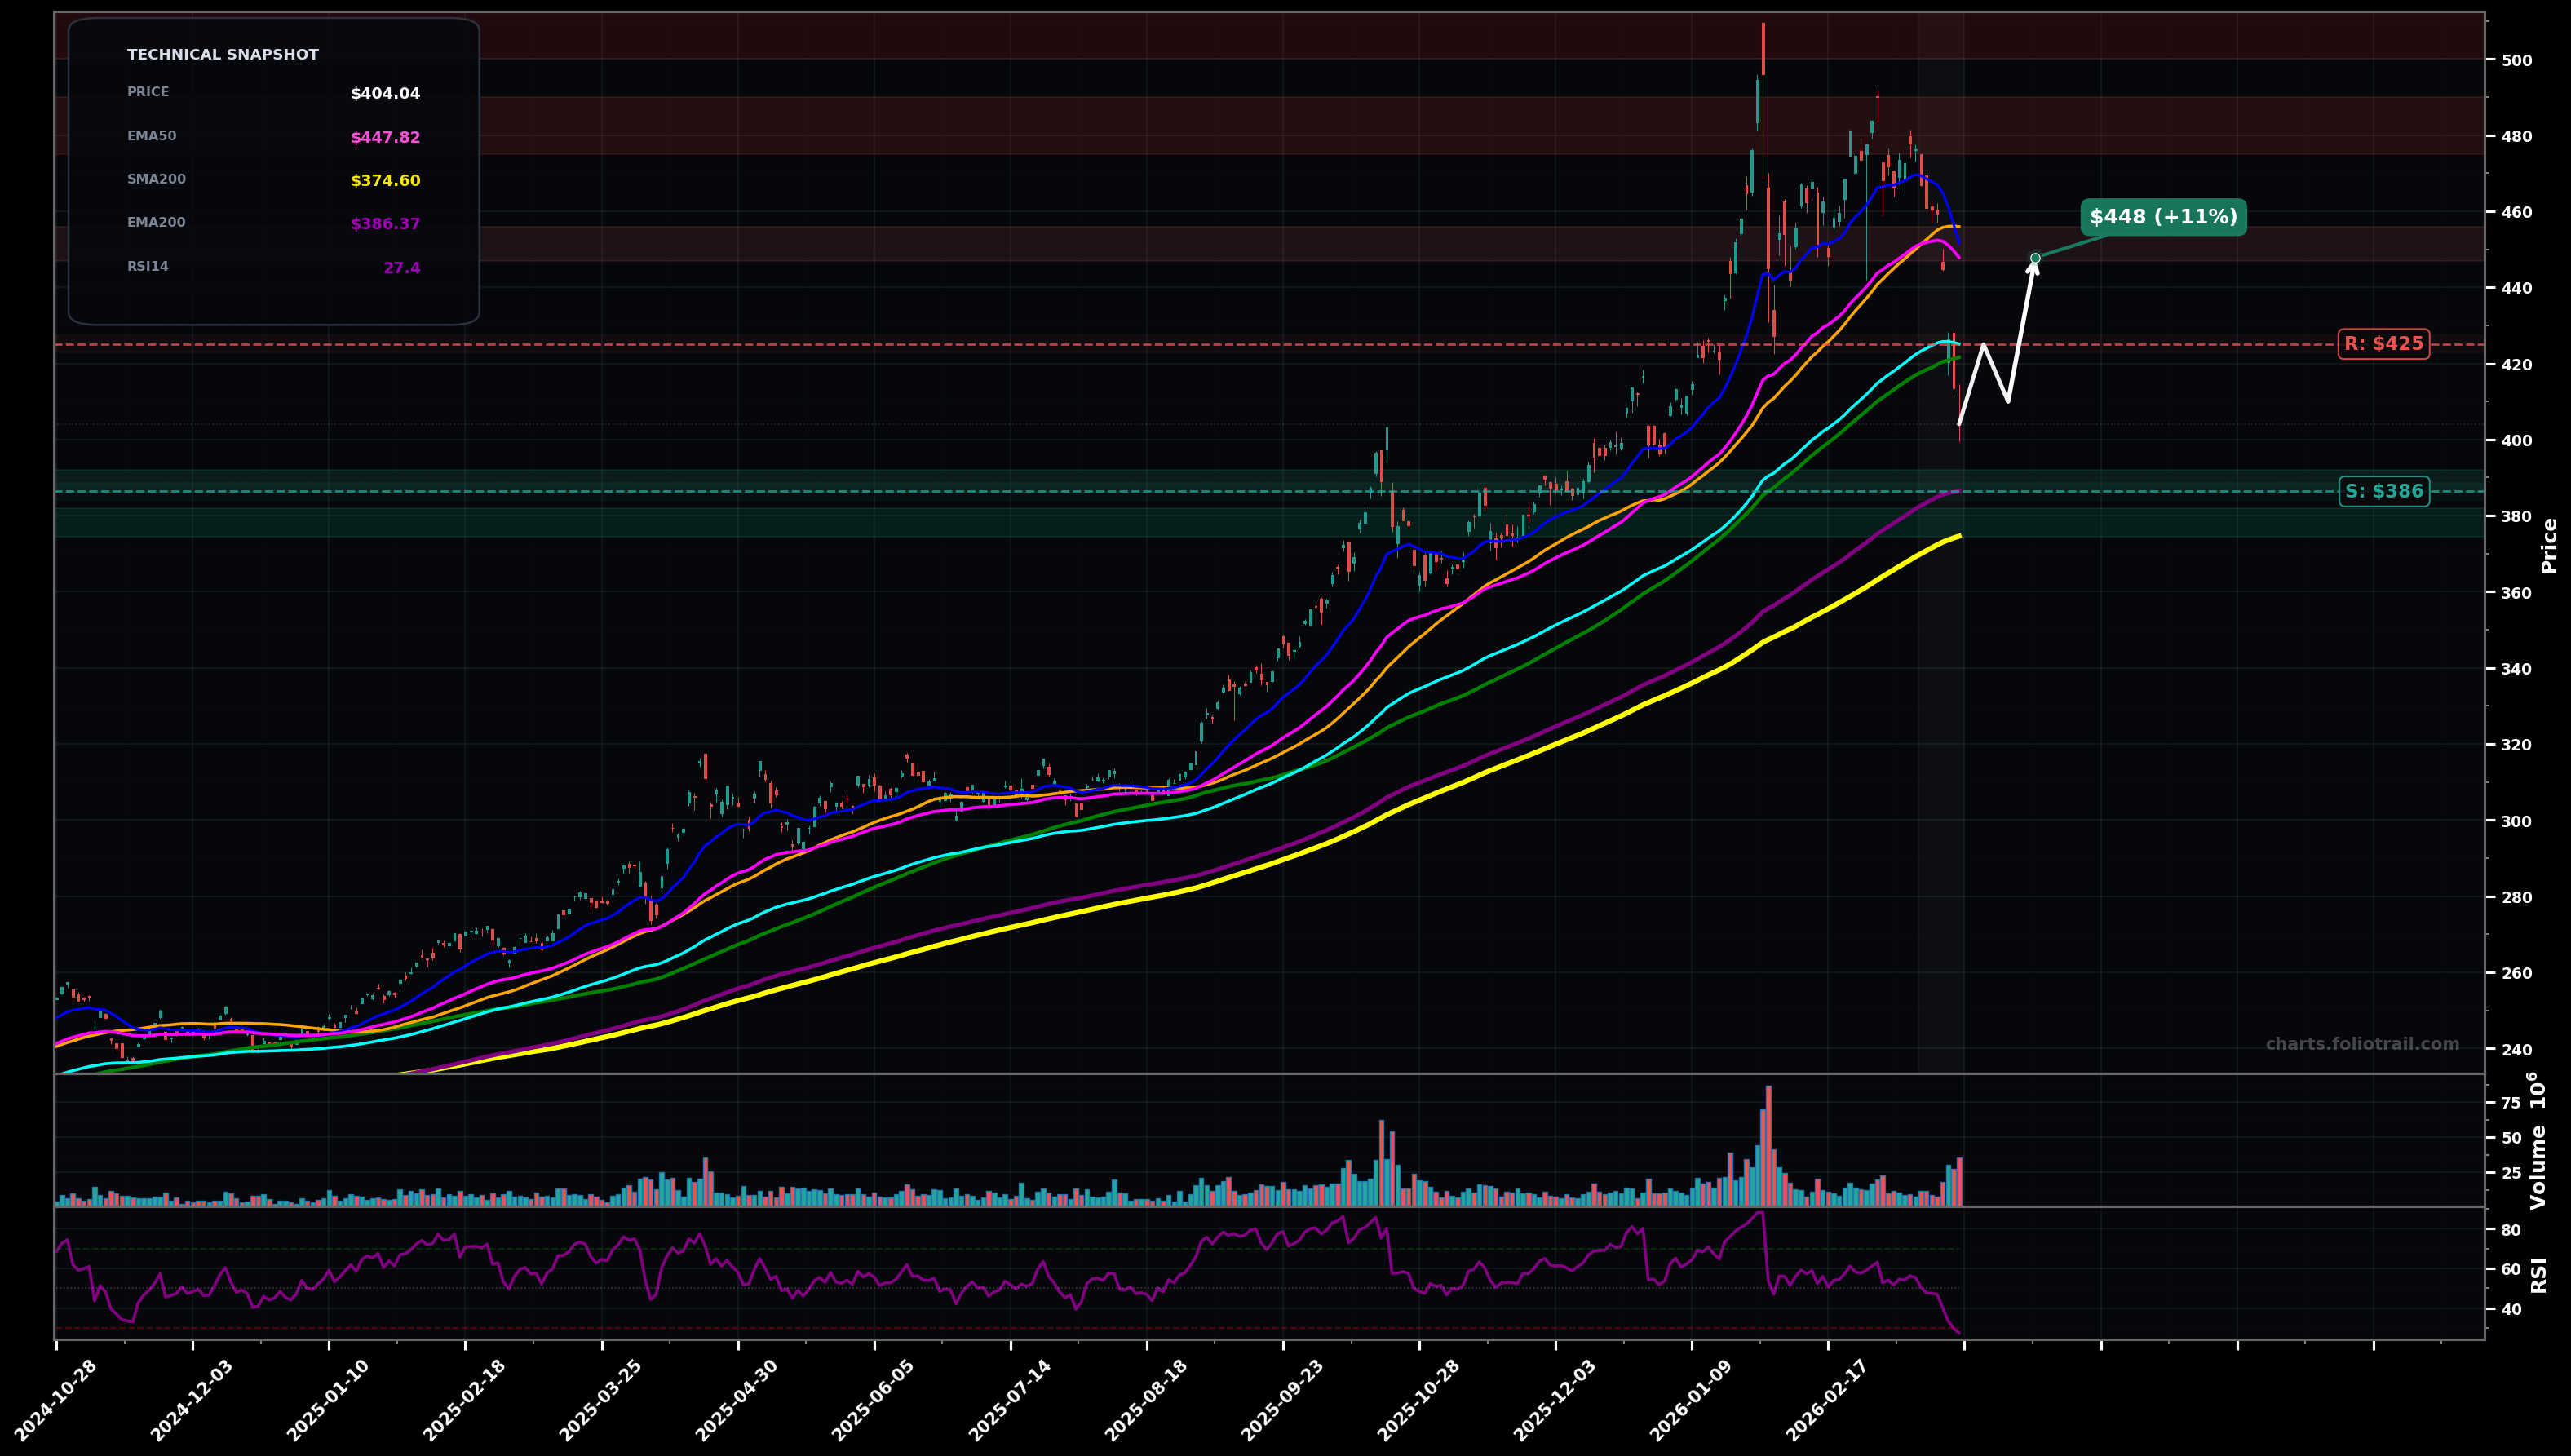
As of March 23, 2026, GLD (SPDR Gold Shares) is in a downtrend state on the daily chart, with a confidence level of 67%. Key support is at $386 and key resistance at $425. Sharp pullback from the $480-$500 blow-off; price ($404.04) is below EMA50 ($447.82) and EMA100 ($425.09) with momentum washed out (RSI14 ~27).
Mean-reversion bounce from EMA200 support, then a lower-high rejection at the EMA100/SMA100 supply zone (corrective rally within a larger pullback).
Support fails: breakdown under EMA200 triggers a deeper retrace toward SMA200, consistent with an Elliott Wave-style Wave C/5th leg down to complete the correction.
Daily close below $386 would confirm continuation lower toward the $375 area.
Two consecutive daily closes back above $425 would invalidate the immediate downtrend pressure (reclaim EMA100/SMA100 zone).
Scale near EMA200 first, add into SMA200/major retrace support, and reserve heavy adds for an overshoot flush that typically occurs in Wave C/5 selloffs.
Trim into declining EMA50/SMA50 resistance first, then into prior distribution/swing-high supply, and fully exit on a retest/extension beyond the prior blow-off top zone.
As of March 23, 2026, GLD (SPDR Gold Shares) is in a downtrend state on the daily chart with 67% confidence. Sharp pullback from the $480-$500 blow-off; price ($404.04) is below EMA50 ($447.82) and EMA100 ($425.09) with momentum washed out (RSI14 ~27).
On the daily timeframe, GLD has key support at $386 and key resistance at $425. The most likely scenario (bullish) targets $425 and $448, with a revert level at $410.
GLD (SPDR Gold Shares) is currently classified as downtrend on the daily chart, with 67% confidence. Confirmation requires: Daily close below $386 would confirm continuation lower toward the $375 area. This would be invalidated by: Two consecutive daily closes back above $425 would invalidate the immediate downtrend pressure (reclaim EMA100/SMA100 zone).
The most likely scenario (bullish) targets $425 and $448, with a revert level at $410. The alternative scenario (bearish) targets $386 and $375.
All content on this website — including charts, analysis, price targets, support/resistance levels, and position zones — is generated entirely by AI and provided for educational and informational purposes only.
This is not financial advice. NEXUSNOIR VENTURES SL (the operator of this website) is not a registered investment adviser or broker-dealer. You should not make investment decisions based solely on this information. Always do your own research and consult a qualified financial advisor.
By continuing, you acknowledge that you have read and agree to our full disclaimer & terms of use and privacy policy.