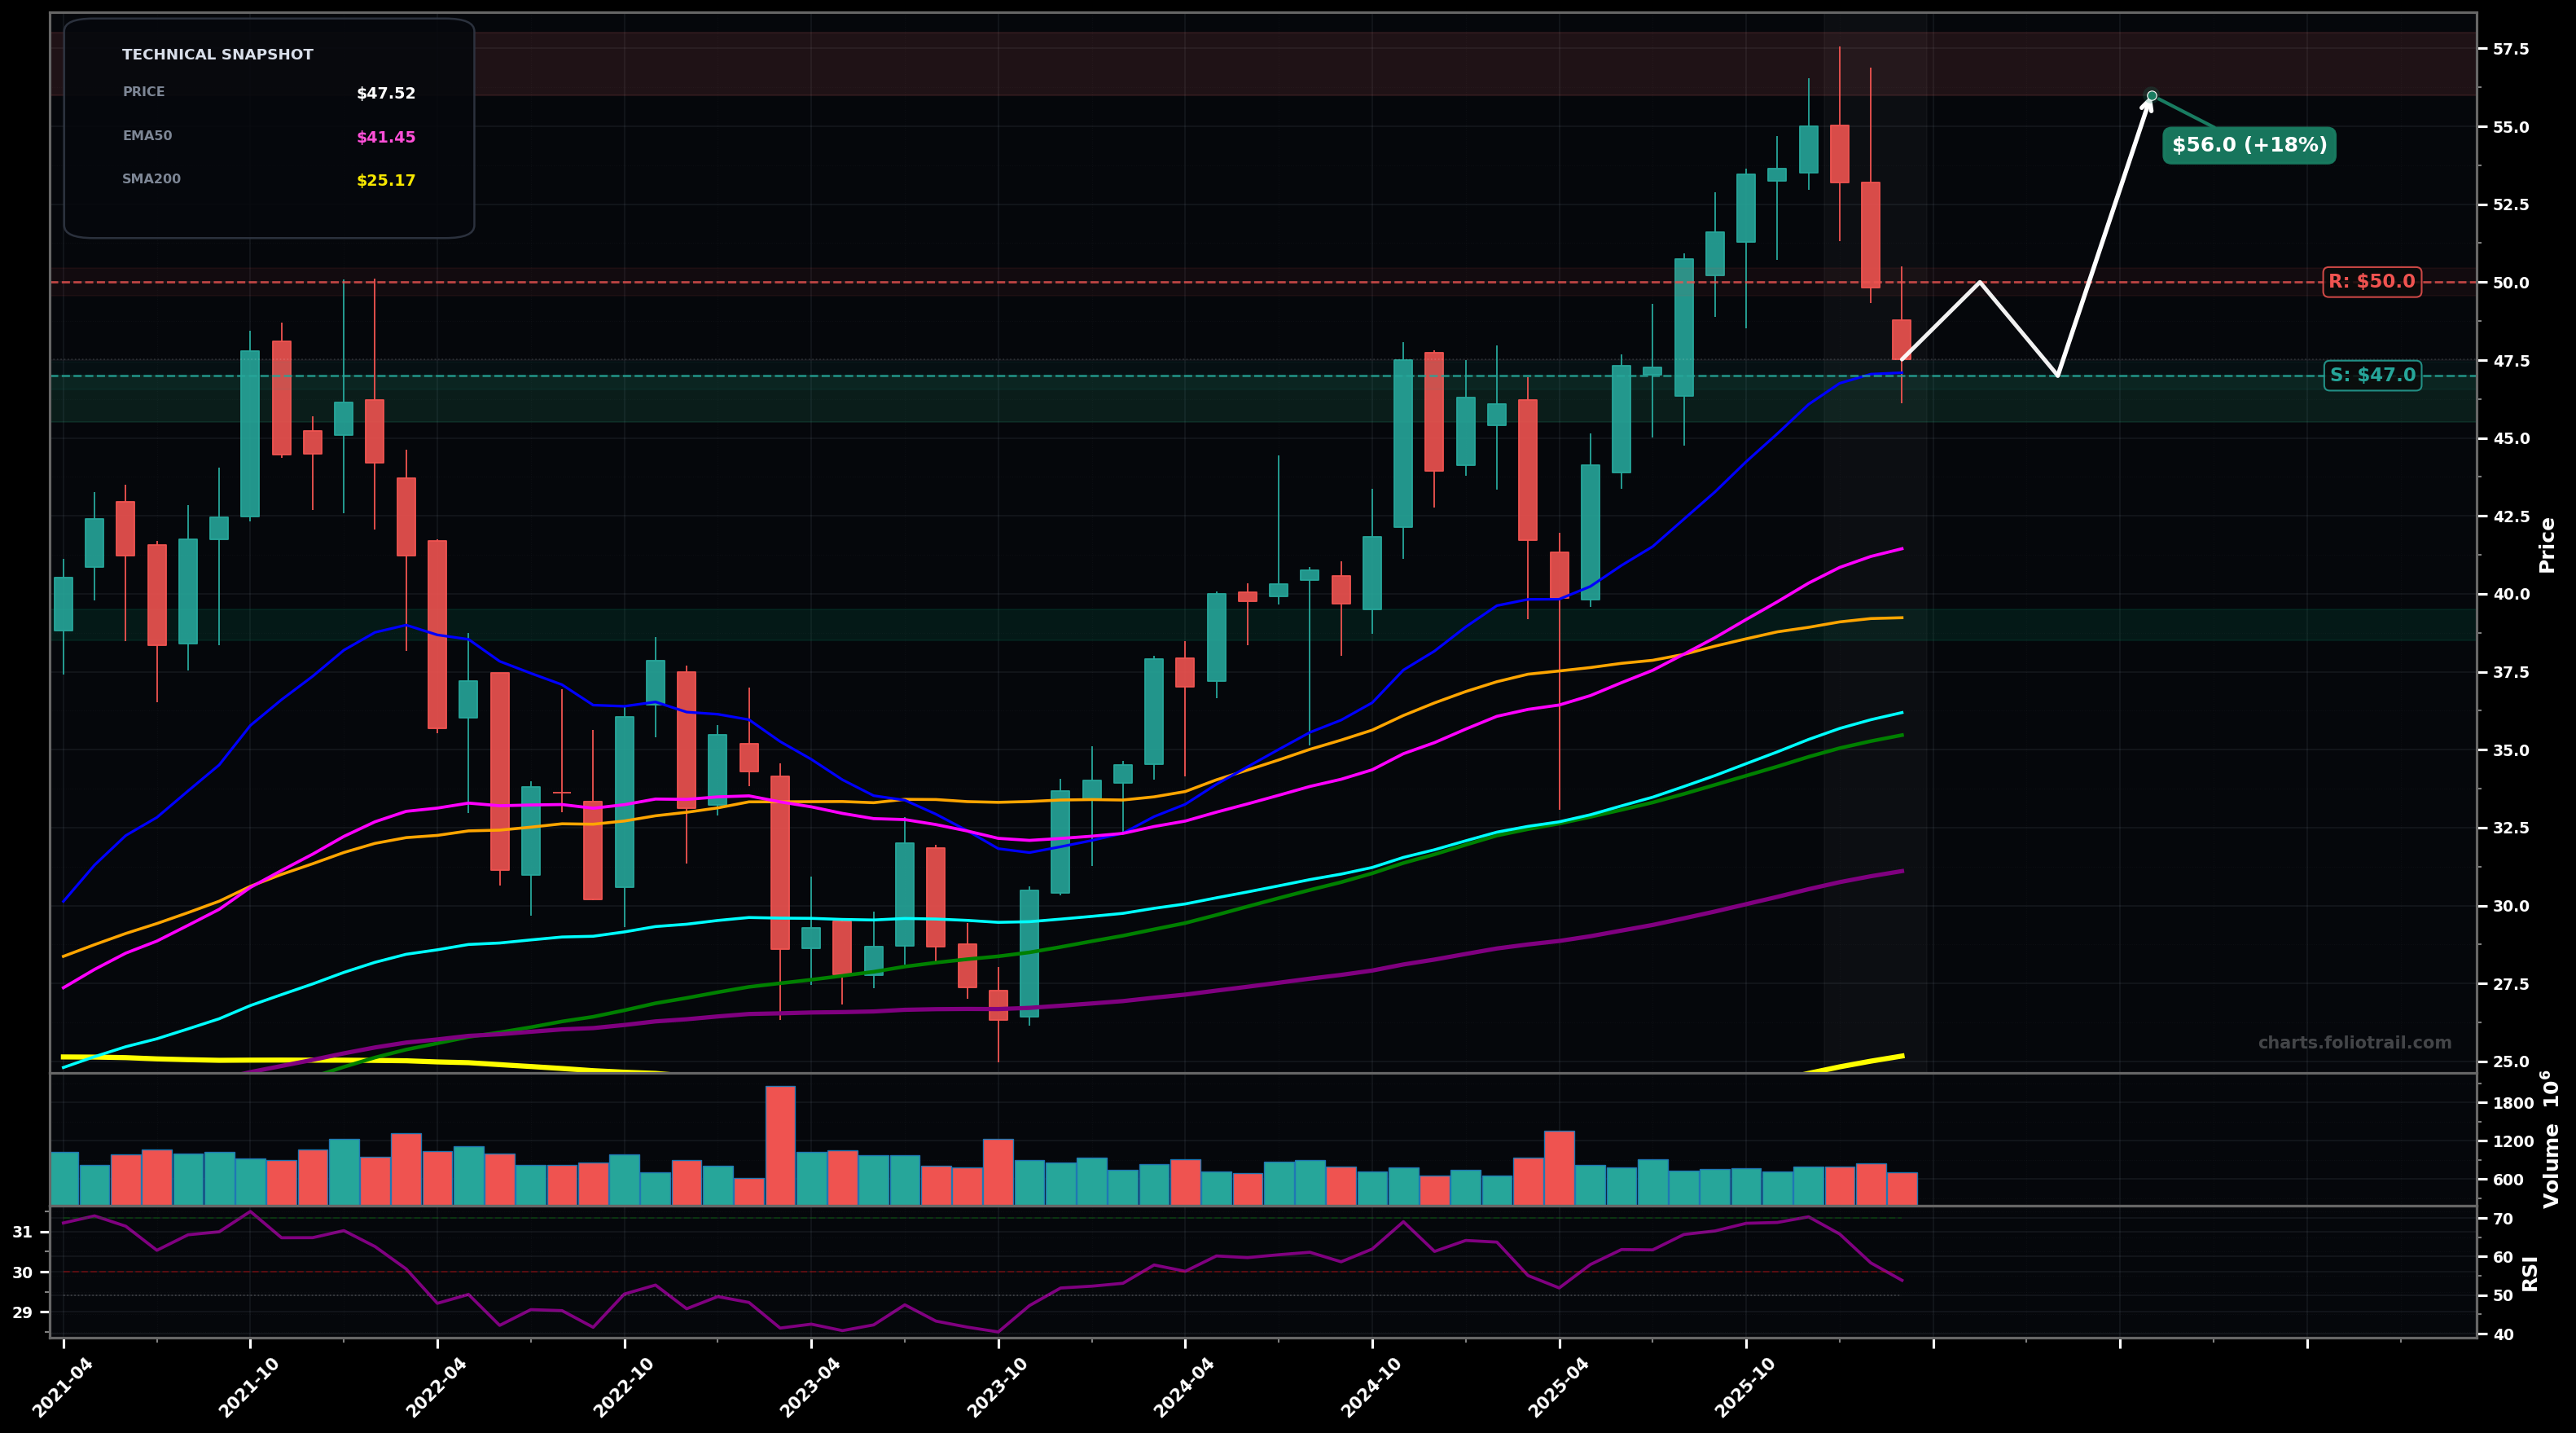
As of March 23, 2026, BAC (Bank of America Corporation) is in a uptrend state on the monthly chart, with a confidence level of 68%. Key support is at $47.0 and key resistance at $50.0. Monthly pullback from ~$56 swing high to ~$47.52, holding above rising EMA20/EMA50 with momentum cooling (RSI~54).
Bullish continuation after a normal Wave 4-style pullback: price stabilizes around $46–$47, then reclaims $50 and grinds toward a retest of the ~$56 high (possible Wave 5 extension). Prob ~60%.
Deeper corrective leg (ABC / Wave 4 expands): loss of $47 leads to mean-reversion toward EMA50 $41.45 and possibly the ~$39–$40 prior breakout zone (near SMA50 $39.23). Prob ~40%.
Monthly close back above $50.00 (reclaim of the round-number + pullback range) would confirm uptrend continuation.
Monthly close below $41.45 (EMA50 pink) would invalidate the clean uptrend state and shift risk toward a deeper correction.
Start near current pullback support; add on EMA50 (pink) retest; heavy add at prior breakout/SMA50 area where Wave-4-type corrections often terminate.
Trim into prior high/overhead supply first; heavier trims on a Fibonacci-style extension above the prior high; close if price becomes multi-year stretched well above rising long MAs (EMA100/EMA200/SMA200).
As of March 23, 2026, BAC (Bank of America Corporation) is in a uptrend state on the monthly chart with 68% confidence. Monthly pullback from ~$56 swing high to ~$47.52, holding above rising EMA20/EMA50 with momentum cooling (RSI~54).
On the monthly timeframe, BAC has key support at $47.0 and key resistance at $50.0. The most likely scenario (bullish) targets $50.0 and $56.0, with a revert level at $47.0.
BAC (Bank of America Corporation) is currently classified as uptrend on the monthly chart, with 68% confidence. Confirmation requires: Monthly close back above $50.00 (reclaim of the round-number + pullback range) would confirm uptrend continuation. This would be invalidated by: Monthly close below $41.45 (EMA50 pink) would invalidate the clean uptrend state and shift risk toward a deeper correction.
The most likely scenario (bullish) targets $50.0 and $56.0, with a revert level at $47.0. The alternative scenario (bearish) targets $41.5 and $39.2.
All content on this website — including charts, analysis, price targets, support/resistance levels, and position zones — is generated entirely by AI and provided for educational and informational purposes only.
This is not financial advice. NEXUSNOIR VENTURES SL (the operator of this website) is not a registered investment adviser or broker-dealer. You should not make investment decisions based solely on this information. Always do your own research and consult a qualified financial advisor.
By continuing, you acknowledge that you have read and agree to our full disclaimer & terms of use and privacy policy.