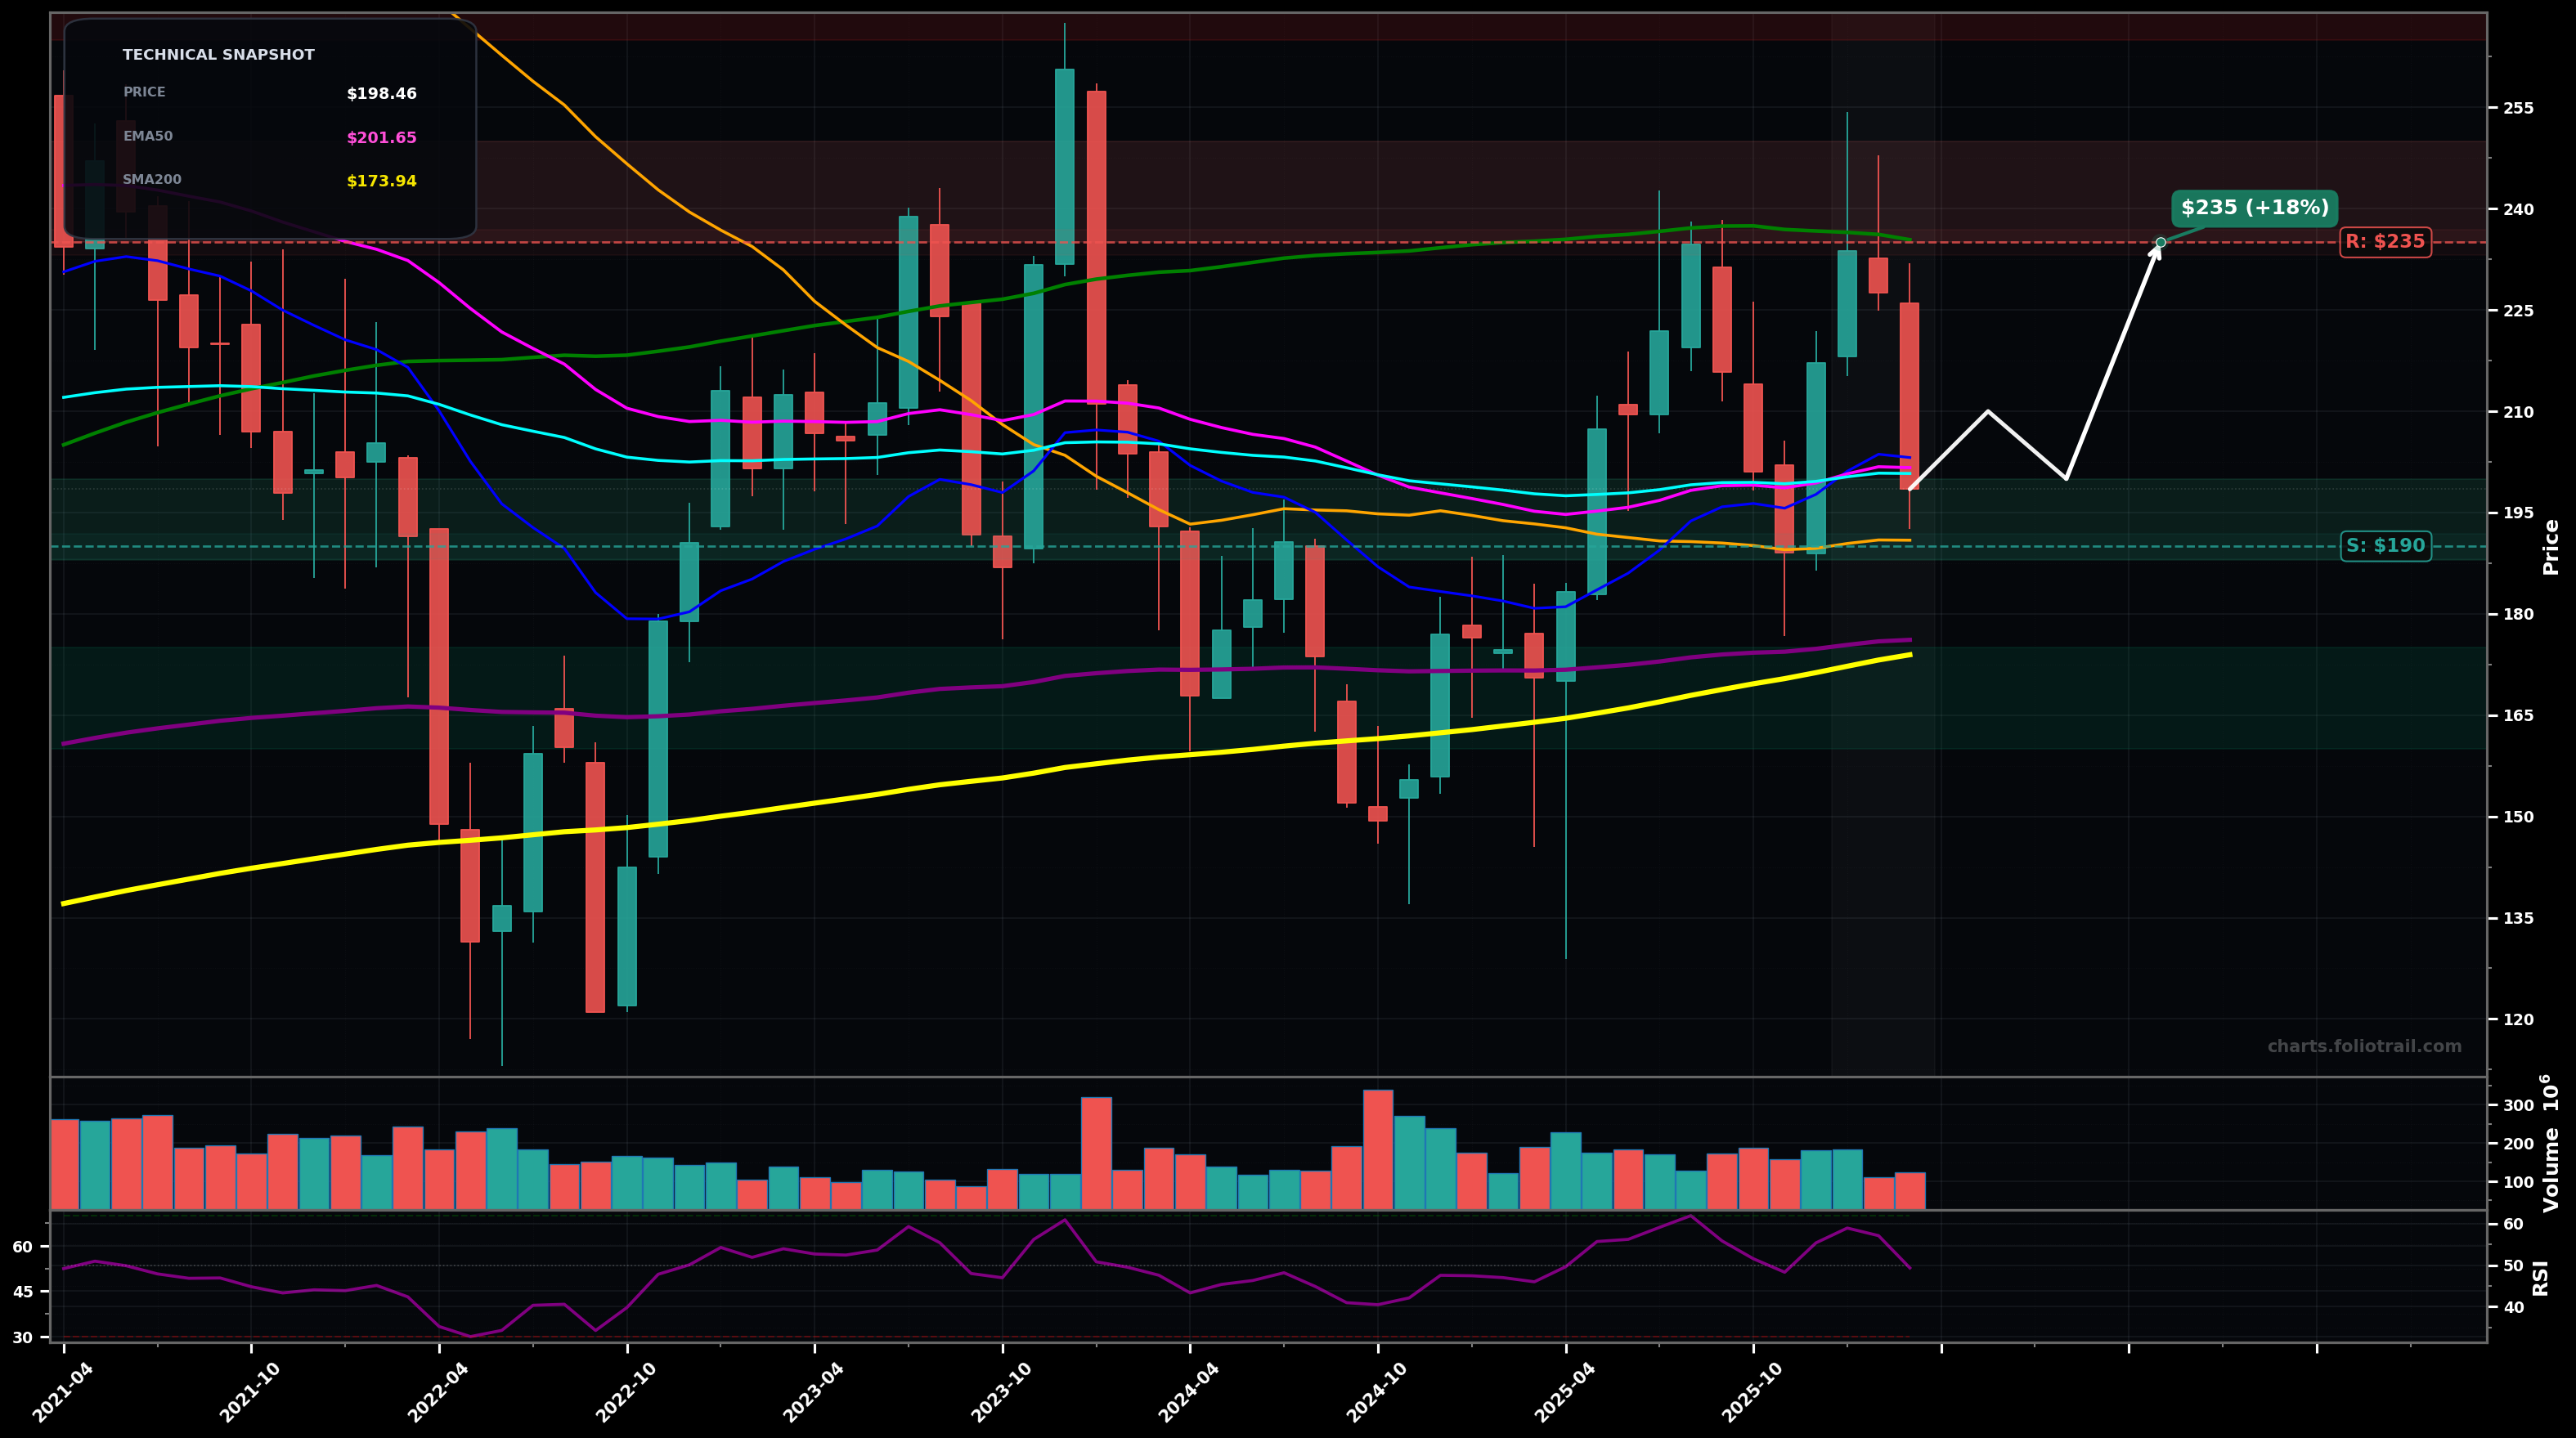
As of March 23, 2026, BA (Boeing Company) is in a choppy range state on the monthly chart, with a confidence level of 62%. Key support is at $190 and key resistance at $235. Monthly pullback to the ~$200 area after failing near the ~$230-$240 supply; price sitting below EMA50/EMA100 and near SMA50.
Mean-reversion/range continuation: bounce attempt from the ~$190-$200 pivot zone back toward the mid/upper range; needs reclaim of EMA50/EMA100 to travel.
Range breaks down: loss of ~$190 opens a retest of the long-term MA cluster/major support (EMA200/SMA200 zone), consistent with an Elliott Wave C/5-type downswing within the broader sideways structure.
State confirmed if monthly closes keep holding between $175 and $235 while EMA50/100 stay flat (no breakout follow-through).
Invalidated on a monthly close above $235 (bull breakout) or below $173 (bear breakdown).
Start near the EMA50/100/SMA50 confluence (~$200); add on range support ~$175-$190; heavy add near long-term support EMA200/SMA200 cluster (~$160-$176).
Trim into the well-defined monthly supply zone ($235-$240+) and prior swing-high area; if price stretches above prior highs, risk of bull-trap/reversion rises in this long-term range.
As of March 23, 2026, BA (Boeing Company) is in a choppy range state on the monthly chart with 62% confidence. Monthly pullback to the ~$200 area after failing near the ~$230-$240 supply; price sitting below EMA50/EMA100 and near SMA50.
On the monthly timeframe, BA has key support at $190 and key resistance at $235. The most likely scenario (bullish) targets $210 and $235, with a revert level at $200.
BA (Boeing Company) is currently classified as choppy range on the monthly chart, with 62% confidence. Confirmation requires: State confirmed if monthly closes keep holding between $175 and $235 while EMA50/100 stay flat (no breakout follow-through). This would be invalidated by: Invalidated on a monthly close above $235 (bull breakout) or below $173 (bear breakdown).
The most likely scenario (bullish) targets $210 and $235, with a revert level at $200. The alternative scenario (bearish) targets $176 and $160.
All content on this website — including charts, analysis, price targets, support/resistance levels, and position zones — is generated entirely by AI and provided for educational and informational purposes only.
This is not financial advice. NEXUSNOIR VENTURES SL (the operator of this website) is not a registered investment adviser or broker-dealer. You should not make investment decisions based solely on this information. Always do your own research and consult a qualified financial advisor.
By continuing, you acknowledge that you have read and agree to our full disclaimer & terms of use and privacy policy.