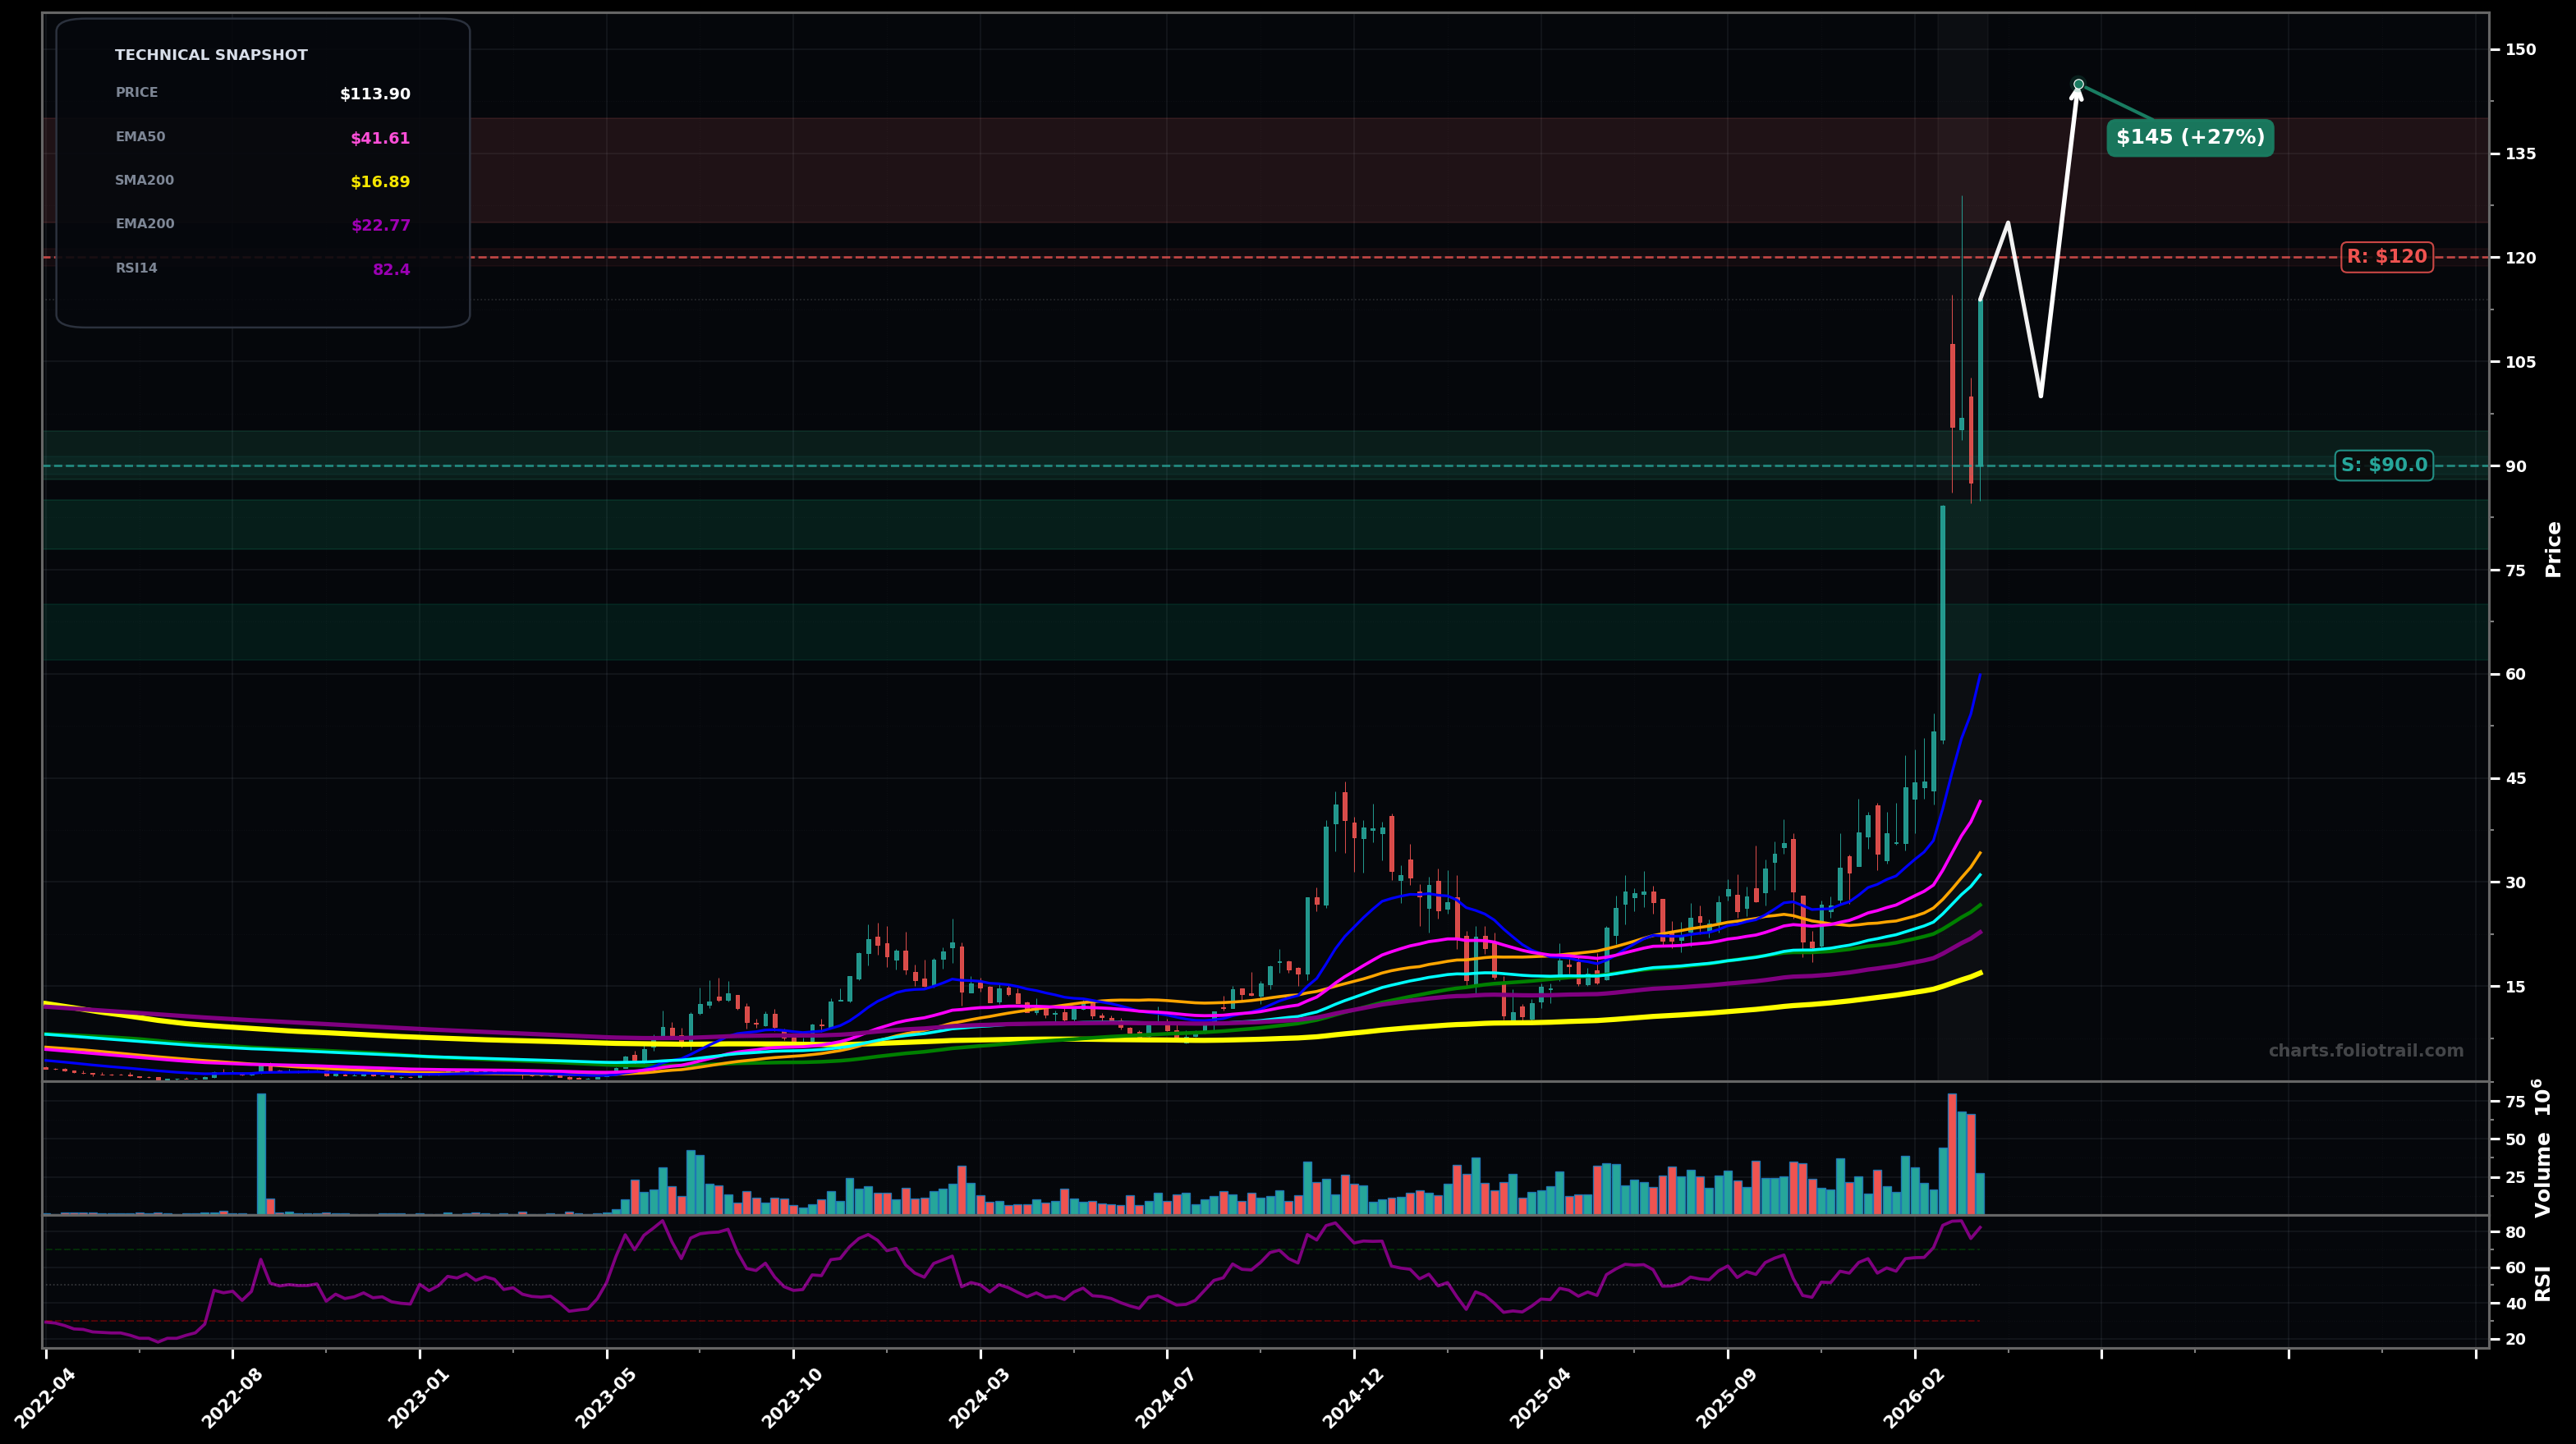
As of March 25, 2026, AAOI (Applied Optoelectronics, Inc.) is in a parabolic state on the weekly chart, with a confidence level of 78%. Key support is at $90.0 and key resistance at $120. Vertical breakout to new highs with heavy volume, then 2–3 week volatility cluster around $90–$120; price still holding well above fast MAs with RSI very overbought.
Parabolic continuation: consolidation resolves up after a shallow pullback/retest (wave (4) type pause) then pushes to new highs; expect sharp intrawave swings.
Mean-reversion unwind: spike was likely an Elliott wave (3)/(5) extension; price makes a deeper ABC pullback toward fast/mid MAs before attempting another up-leg.
Weekly close above $120 with follow-through (next week holds >$115).
Weekly close below $90 (break of the post-spike swing support).
Buy zones are aligned to the post-spike swing support (~$90), then a deeper EMA50/EMA100 mean-reversion area, then a larger Fib retrace/base-retest zone if an ABC correction expands.
Trims scale into new highs where extension vs EMA50/EMA100 is extreme (parabolic risk); higher bands assume a continued Elliott impulse extension where blow-off/fast retrace probability rises.
As of March 25, 2026, AAOI (Applied Optoelectronics, Inc.) is in a parabolic state on the weekly chart with 78% confidence. Vertical breakout to new highs with heavy volume, then 2–3 week volatility cluster around $90–$120; price still holding well above fast MAs with RSI very overbought.
On the weekly timeframe, AAOI has key support at $90.0 and key resistance at $120. The most likely scenario (bullish) targets $125 and $145, with a revert level at $100.
AAOI (Applied Optoelectronics, Inc.) is currently classified as parabolic on the weekly chart, with 78% confidence. Confirmation requires: Weekly close above $120 with follow-through (next week holds >$115). This would be invalidated by: Weekly close below $90 (break of the post-spike swing support).
The most likely scenario (bullish) targets $125 and $145, with a revert level at $100. The alternative scenario (bearish) targets $80.0 and $65.0.
Multi-layer AI agents analyse 200+ stocks across daily, weekly, and monthly timeframes — producing market state classifications, price scenarios with targets, and position entry/exit levels. Updated every trading day after market close. No paywall. No sign-up required.
Built by Foliotrail.
All content on this website — including charts, analysis, price targets, support/resistance levels, and position zones — is generated entirely by AI and provided for educational and informational purposes only.
This is not financial advice. NEXUSNOIR VENTURES SL (the operator of this website) is not a registered investment adviser or broker-dealer. You should not make investment decisions based solely on this information. Always do your own research and consult a qualified financial advisor.
By continuing, you acknowledge that you have read and agree to our full disclaimer & terms of use and privacy policy.