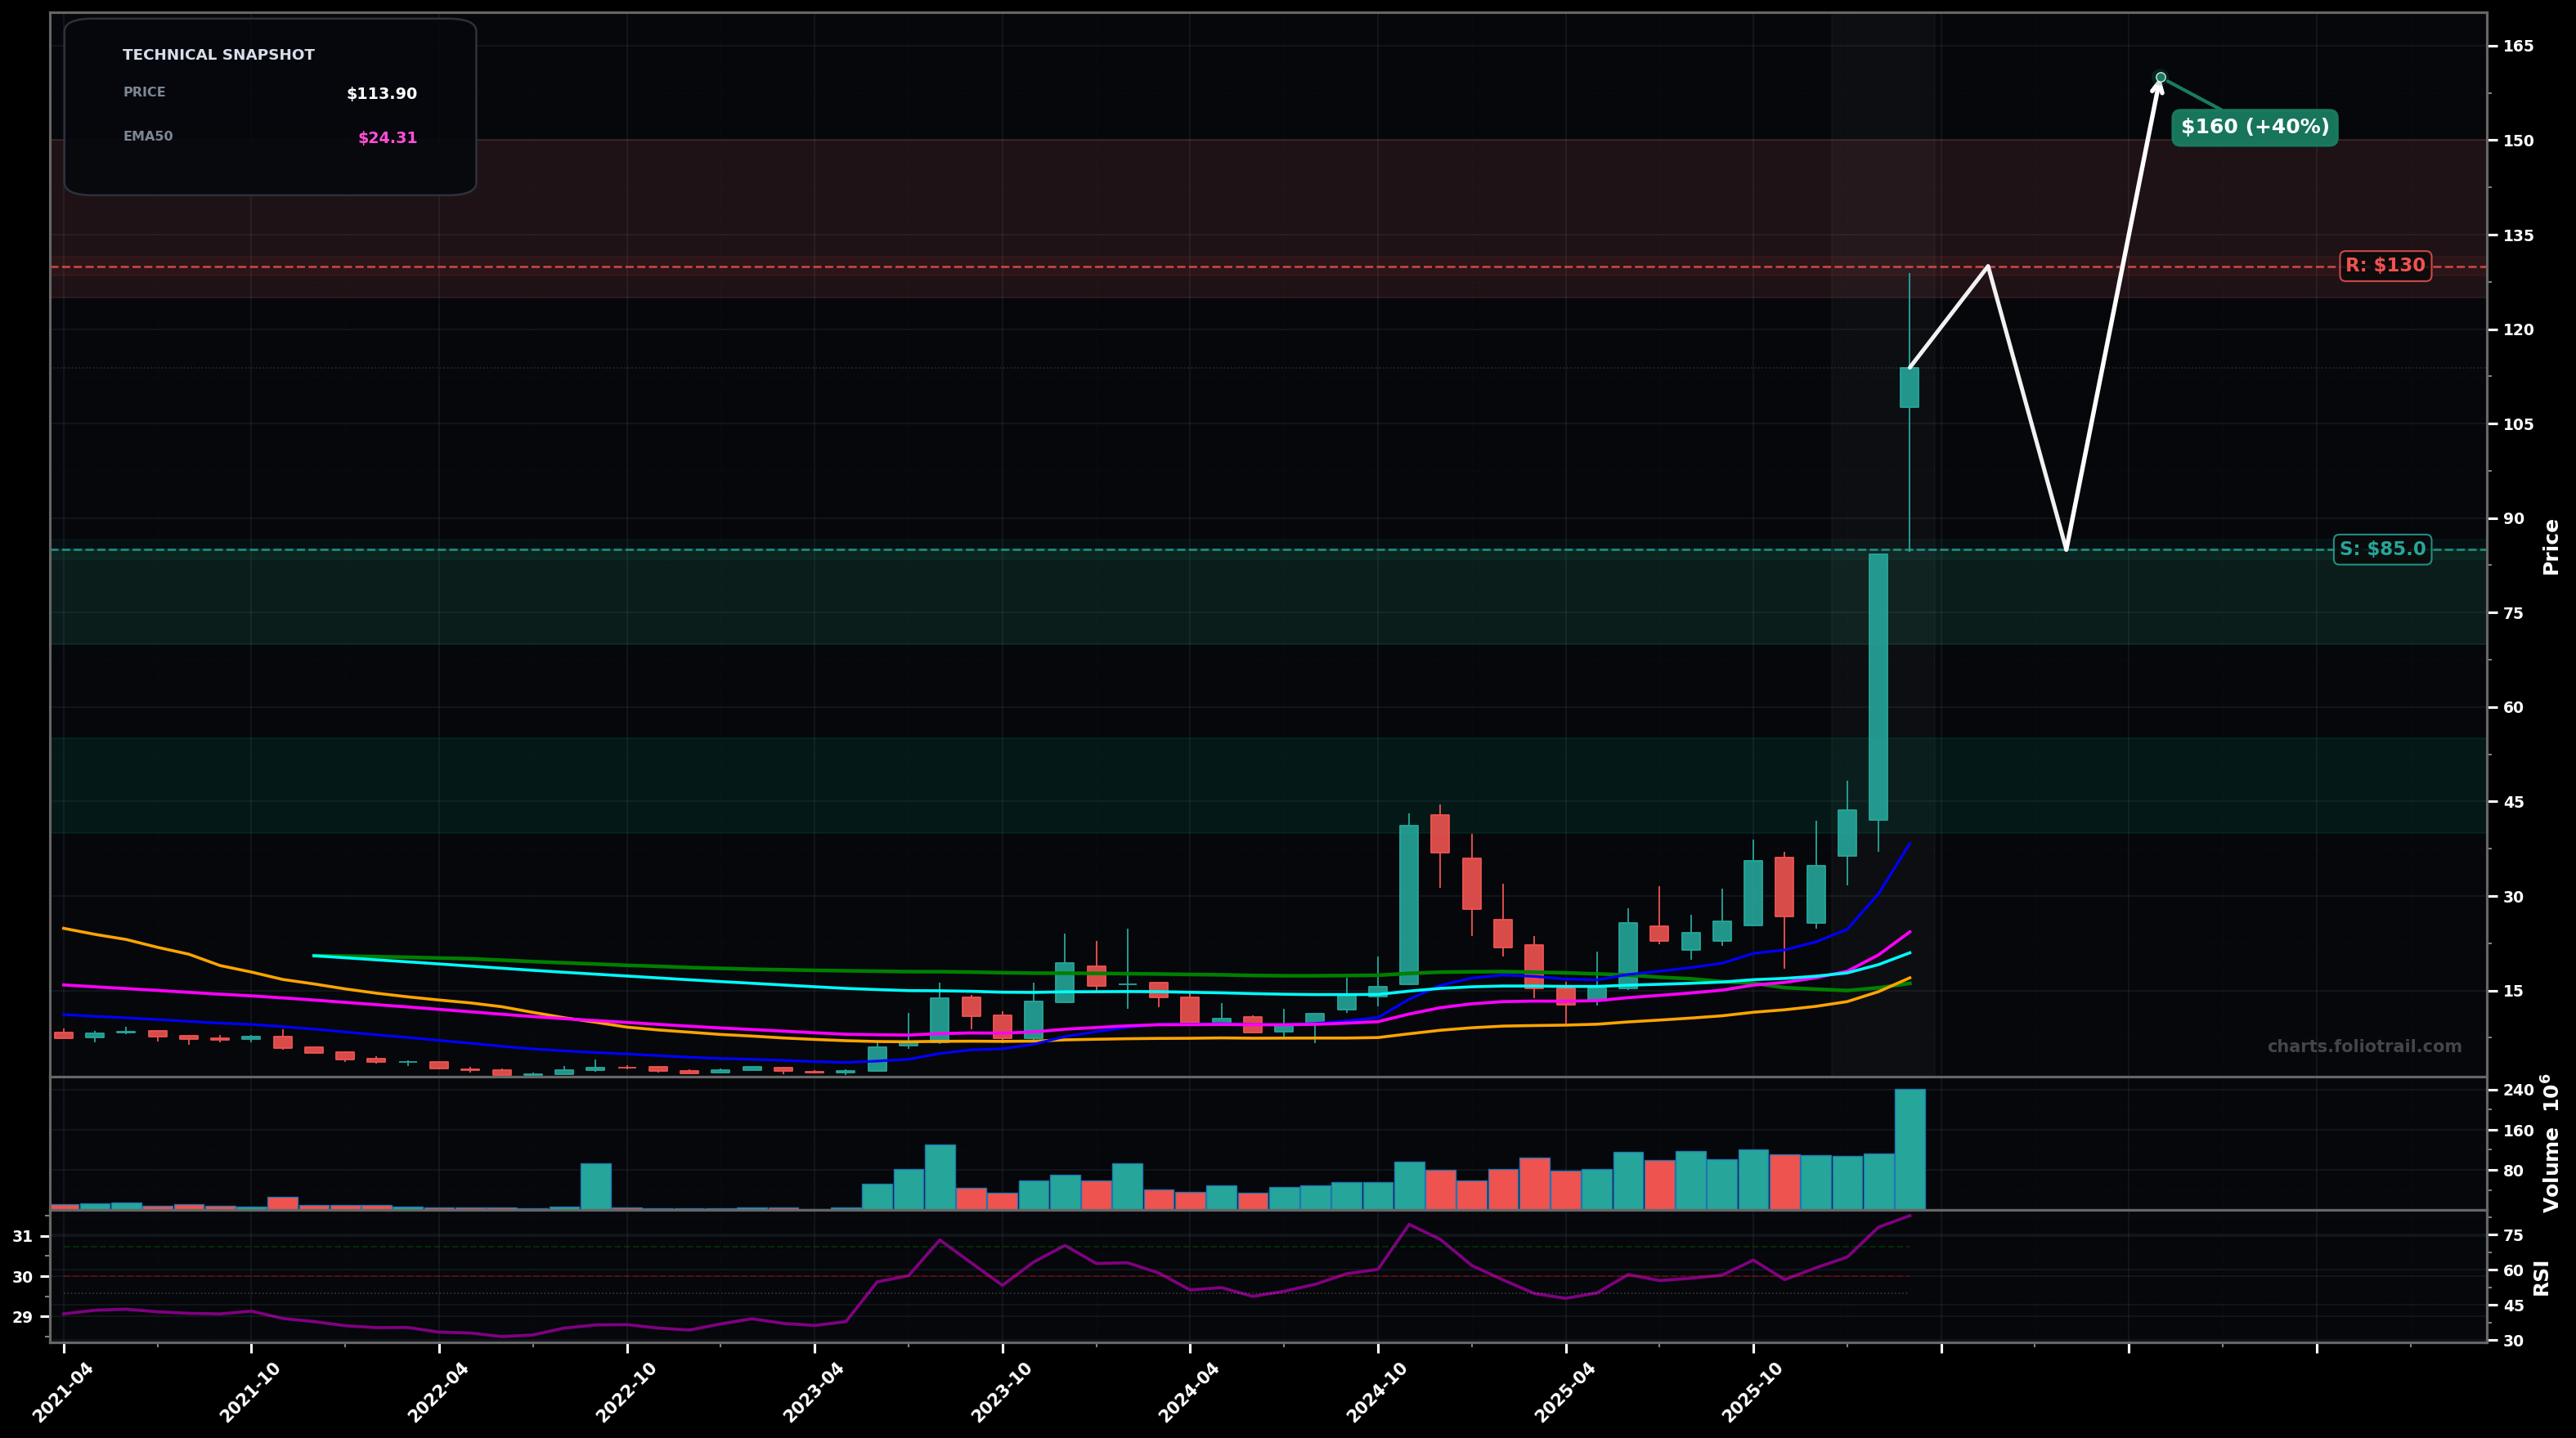
As of March 25, 2026, AAOI (Applied Optoelectronics, Inc.) is in a parabolic state on the monthly chart, with a confidence level of 78%. Key support is at $85.0 and key resistance at $130. Monthly vertical breakout to ~$113.90 on extreme volume; price massively extended above all key MAs with RSI ~83 (overbought) and wide-range green candles (volatility expansion).
Bullish continuation but with a likely cooldown: consolidate above prior breakout zone, then attempt another push higher (Elliott: late Wave 3/early Wave 5 behavior; risk of Wave 4 digestion).
Mean-reversion correction (Elliott: Wave 4 / ABC): sharp pullback toward the breakout base/fast MAs, then stabilize for a new range before any next leg.
2 monthly closes holding above $85 would confirm the parabolic advance remains intact
Monthly close back below $50 would invalidate the parabolic structure and signal a deeper mean-reversion risk
Zones align with likely post-breakout retest (around $85), then deeper Fibonacci-style retrace levels of the vertical leg (toward ~$70 and ~$50) if a Wave-4/ABC unwind accelerates.
Price is extremely stretched vs EMA50/EMA100 on monthly; trimming into strength is favored as momentum-climax risk rises, especially near round-number extensions and prior blow-off style candles.
As of March 25, 2026, AAOI (Applied Optoelectronics, Inc.) is in a parabolic state on the monthly chart with 78% confidence. Monthly vertical breakout to ~$113.90 on extreme volume; price massively extended above all key MAs with RSI ~83 (overbought) and wide-range green candles (volatility expansion).
On the monthly timeframe, AAOI has key support at $85.0 and key resistance at $130. The most likely scenario (bullish) targets $130 and $160, with a revert level at $85.0.
AAOI (Applied Optoelectronics, Inc.) is currently classified as parabolic on the monthly chart, with 78% confidence. Confirmation requires: 2 monthly closes holding above $85 would confirm the parabolic advance remains intact This would be invalidated by: Monthly close back below $50 would invalidate the parabolic structure and signal a deeper mean-reversion risk
The most likely scenario (bullish) targets $130 and $160, with a revert level at $85.0. The alternative scenario (bearish) targets $70.0 and $50.0.
Multi-layer AI agents analyse 200+ stocks across daily, weekly, and monthly timeframes — producing market state classifications, price scenarios with targets, and position entry/exit levels. Updated every trading day after market close. No paywall. No sign-up required.
Built by Foliotrail.
All content on this website — including charts, analysis, price targets, support/resistance levels, and position zones — is generated entirely by AI and provided for educational and informational purposes only.
This is not financial advice. NEXUSNOIR VENTURES SL (the operator of this website) is not a registered investment adviser or broker-dealer. You should not make investment decisions based solely on this information. Always do your own research and consult a qualified financial advisor.
By continuing, you acknowledge that you have read and agree to our full disclaimer & terms of use and privacy policy.