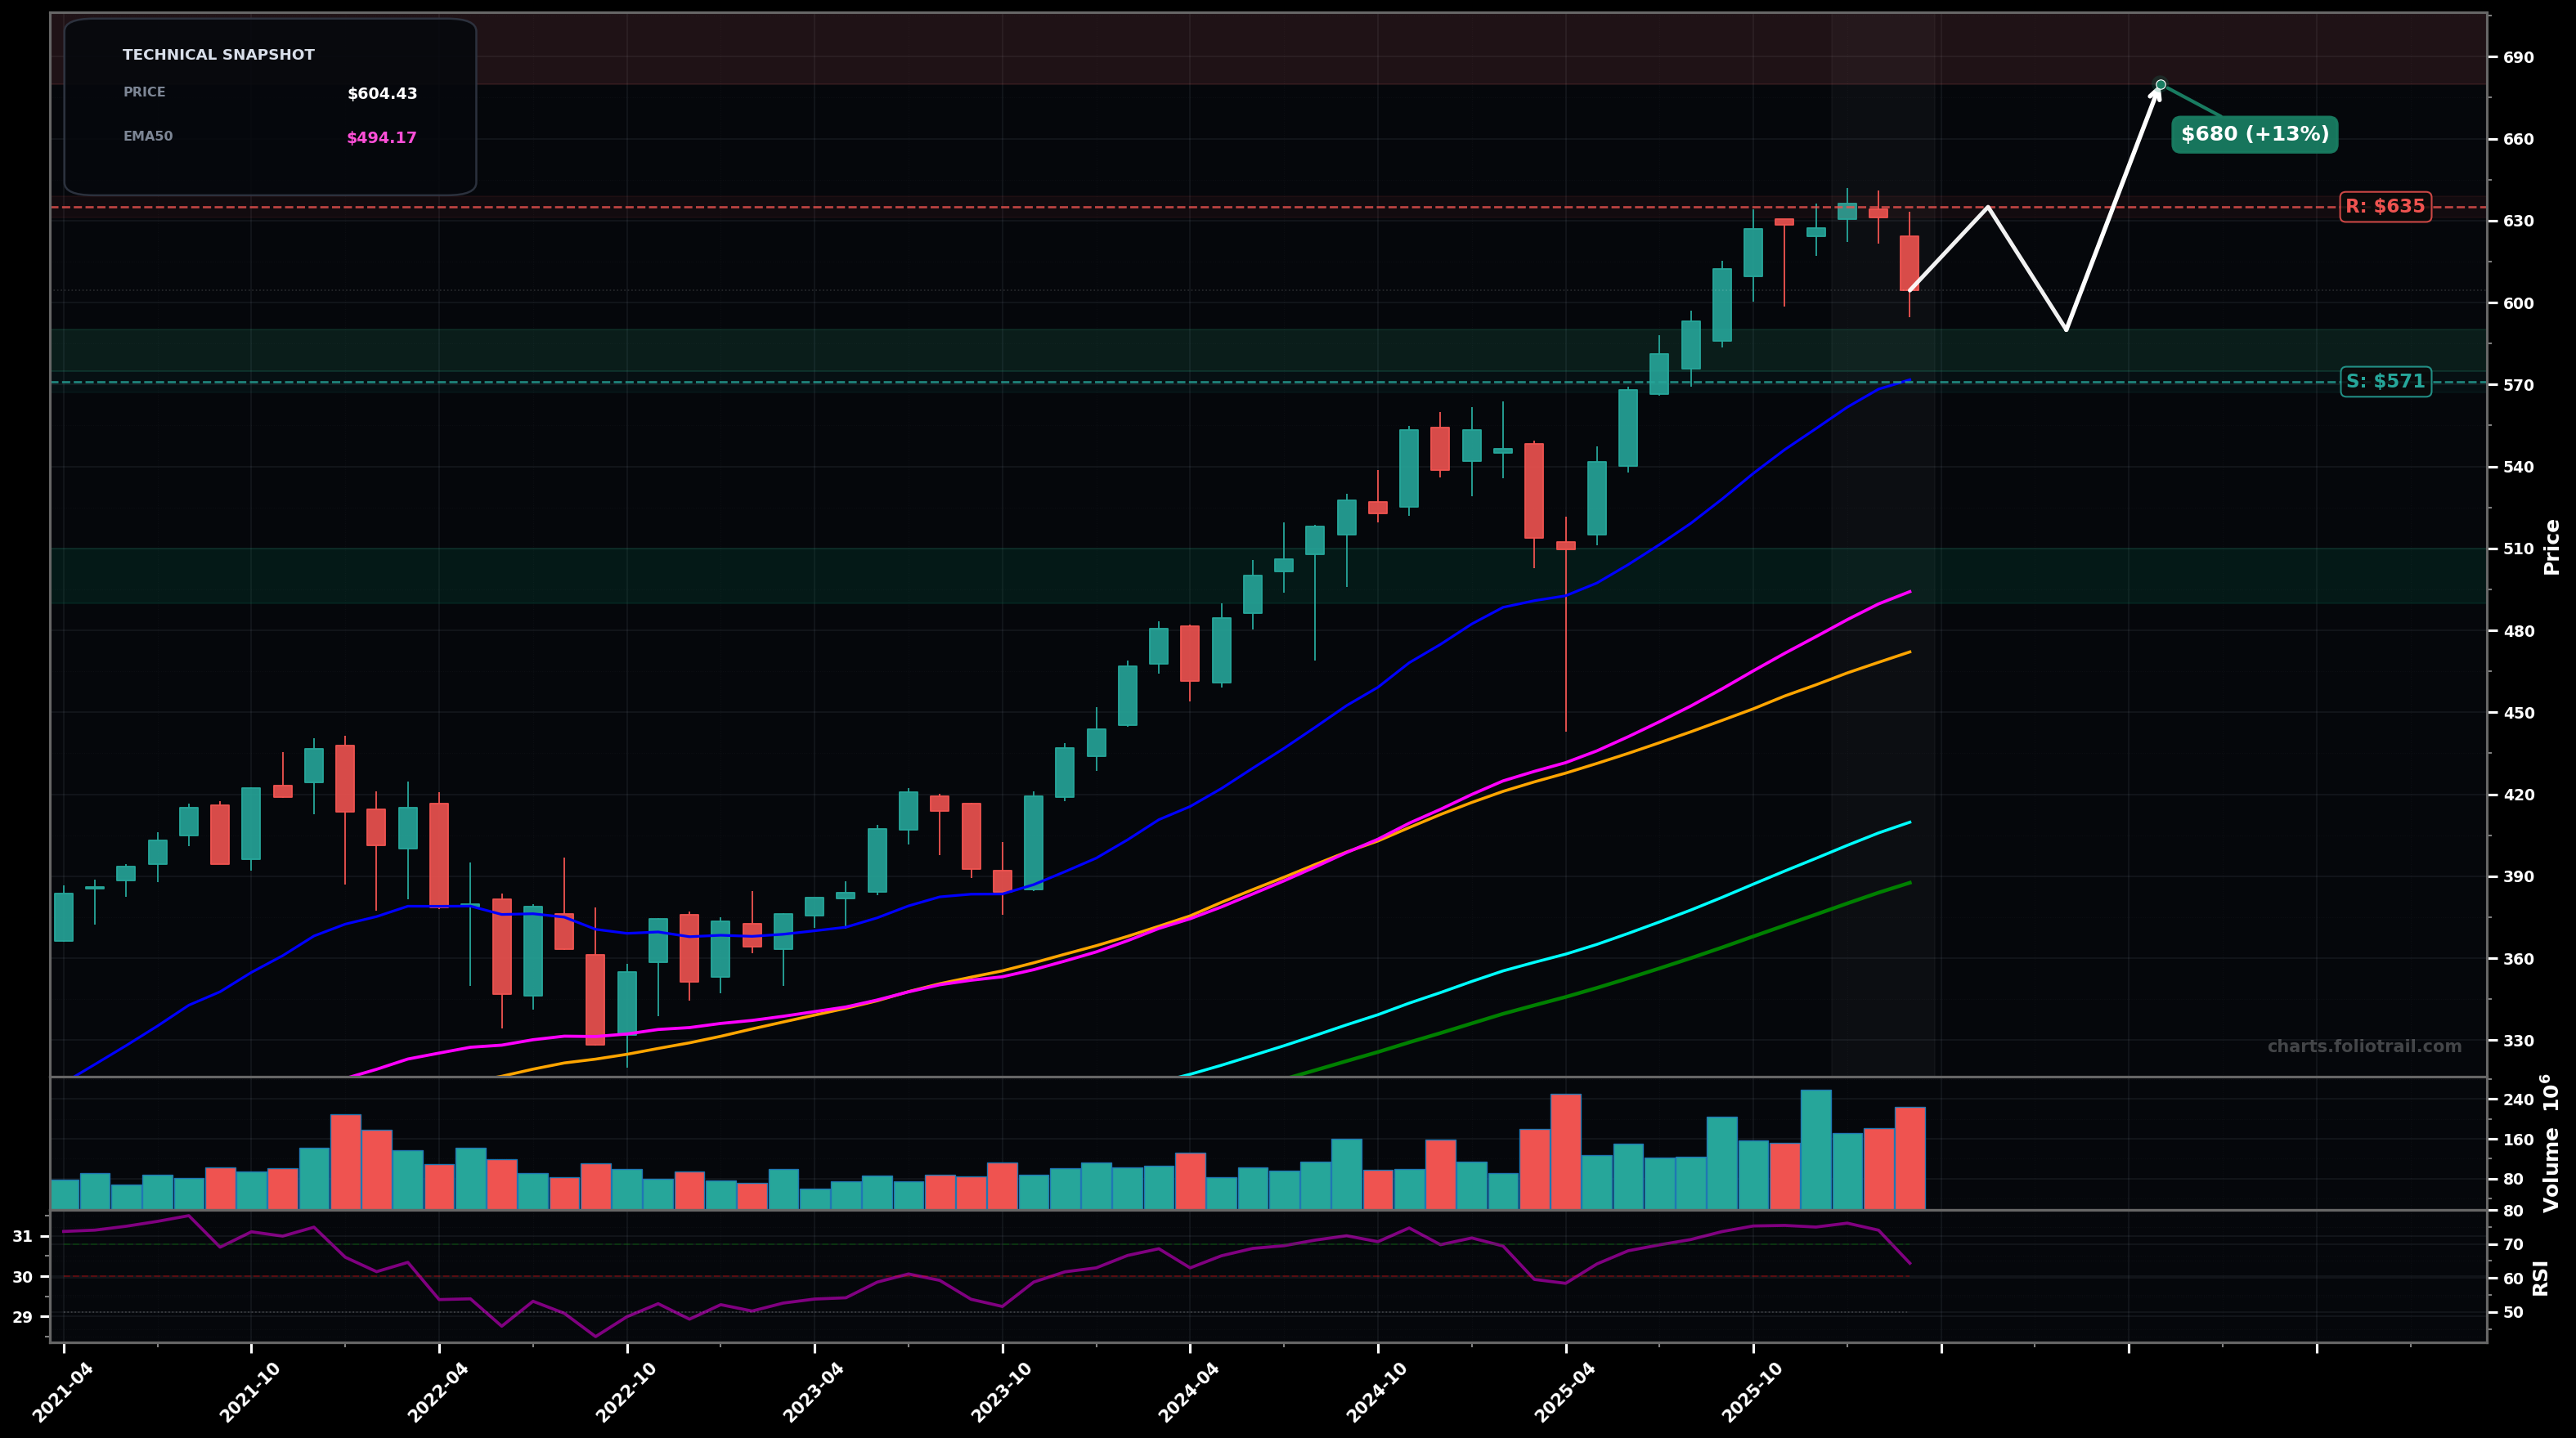
As of March 24, 2026, VOO (Vanguard S&P 500 ETF) is in a uptrend state on the monthly chart, with a confidence level of 72%. Key support is at $571 and key resistance at $635. Monthly uptrend pulled back from a new high (~$630-$635) with two red months; price still well above rising EMA50/EMA100 and above SMA50.
Bullish continuation: pullback holds above the ~$571 swing/20EMA area, then price grinds higher and breaks the prior high, targeting a measured extension.
Deeper correction within the larger uptrend: failure to reclaim $630 leads to a multi-month ABC pullback toward the rising EMA50/SMA50 zone before attempting a new up-leg.
Monthly close back above $630
Monthly close below $571 (loss of the fast trend/20EMA area shown near ~$572)
Start near prior swing/20EMA support ($571) if it holds; add on a deeper ABC into the mid-$500s; heavy add at confluence of EMA50 (pink ~$494) + SMA50 (orange ~$472) rising into the $490-$510 area.
Trim into upside extensions after a clean breakout above ~$635 (likely wave-5/extension risk); increase trimming as price becomes increasingly stretched above EMA50/EMA100 on monthly; full close only in an extreme multi-year overshoot zone.
As of March 24, 2026, VOO (Vanguard S&P 500 ETF) is in a uptrend state on the monthly chart with 72% confidence. Monthly uptrend pulled back from a new high (~$630-$635) with two red months; price still well above rising EMA50/EMA100 and above SMA50.
On the monthly timeframe, VOO has key support at $571 and key resistance at $635. The most likely scenario (bullish) targets $635 and $680, with a revert level at $590.
VOO (Vanguard S&P 500 ETF) is currently classified as uptrend on the monthly chart, with 72% confidence. Confirmation requires: Monthly close back above $630 This would be invalidated by: Monthly close below $571 (loss of the fast trend/20EMA area shown near ~$572)
The most likely scenario (bullish) targets $635 and $680, with a revert level at $590. The alternative scenario (bearish) targets $571 and $510.
All content on this website — including charts, analysis, price targets, support/resistance levels, and position zones — is generated entirely by AI and provided for educational and informational purposes only.
This is not financial advice. NEXUSNOIR VENTURES SL (the operator of this website) is not a registered investment adviser or broker-dealer. You should not make investment decisions based solely on this information. Always do your own research and consult a qualified financial advisor.
By continuing, you acknowledge that you have read and agree to our full disclaimer & terms of use and privacy policy.