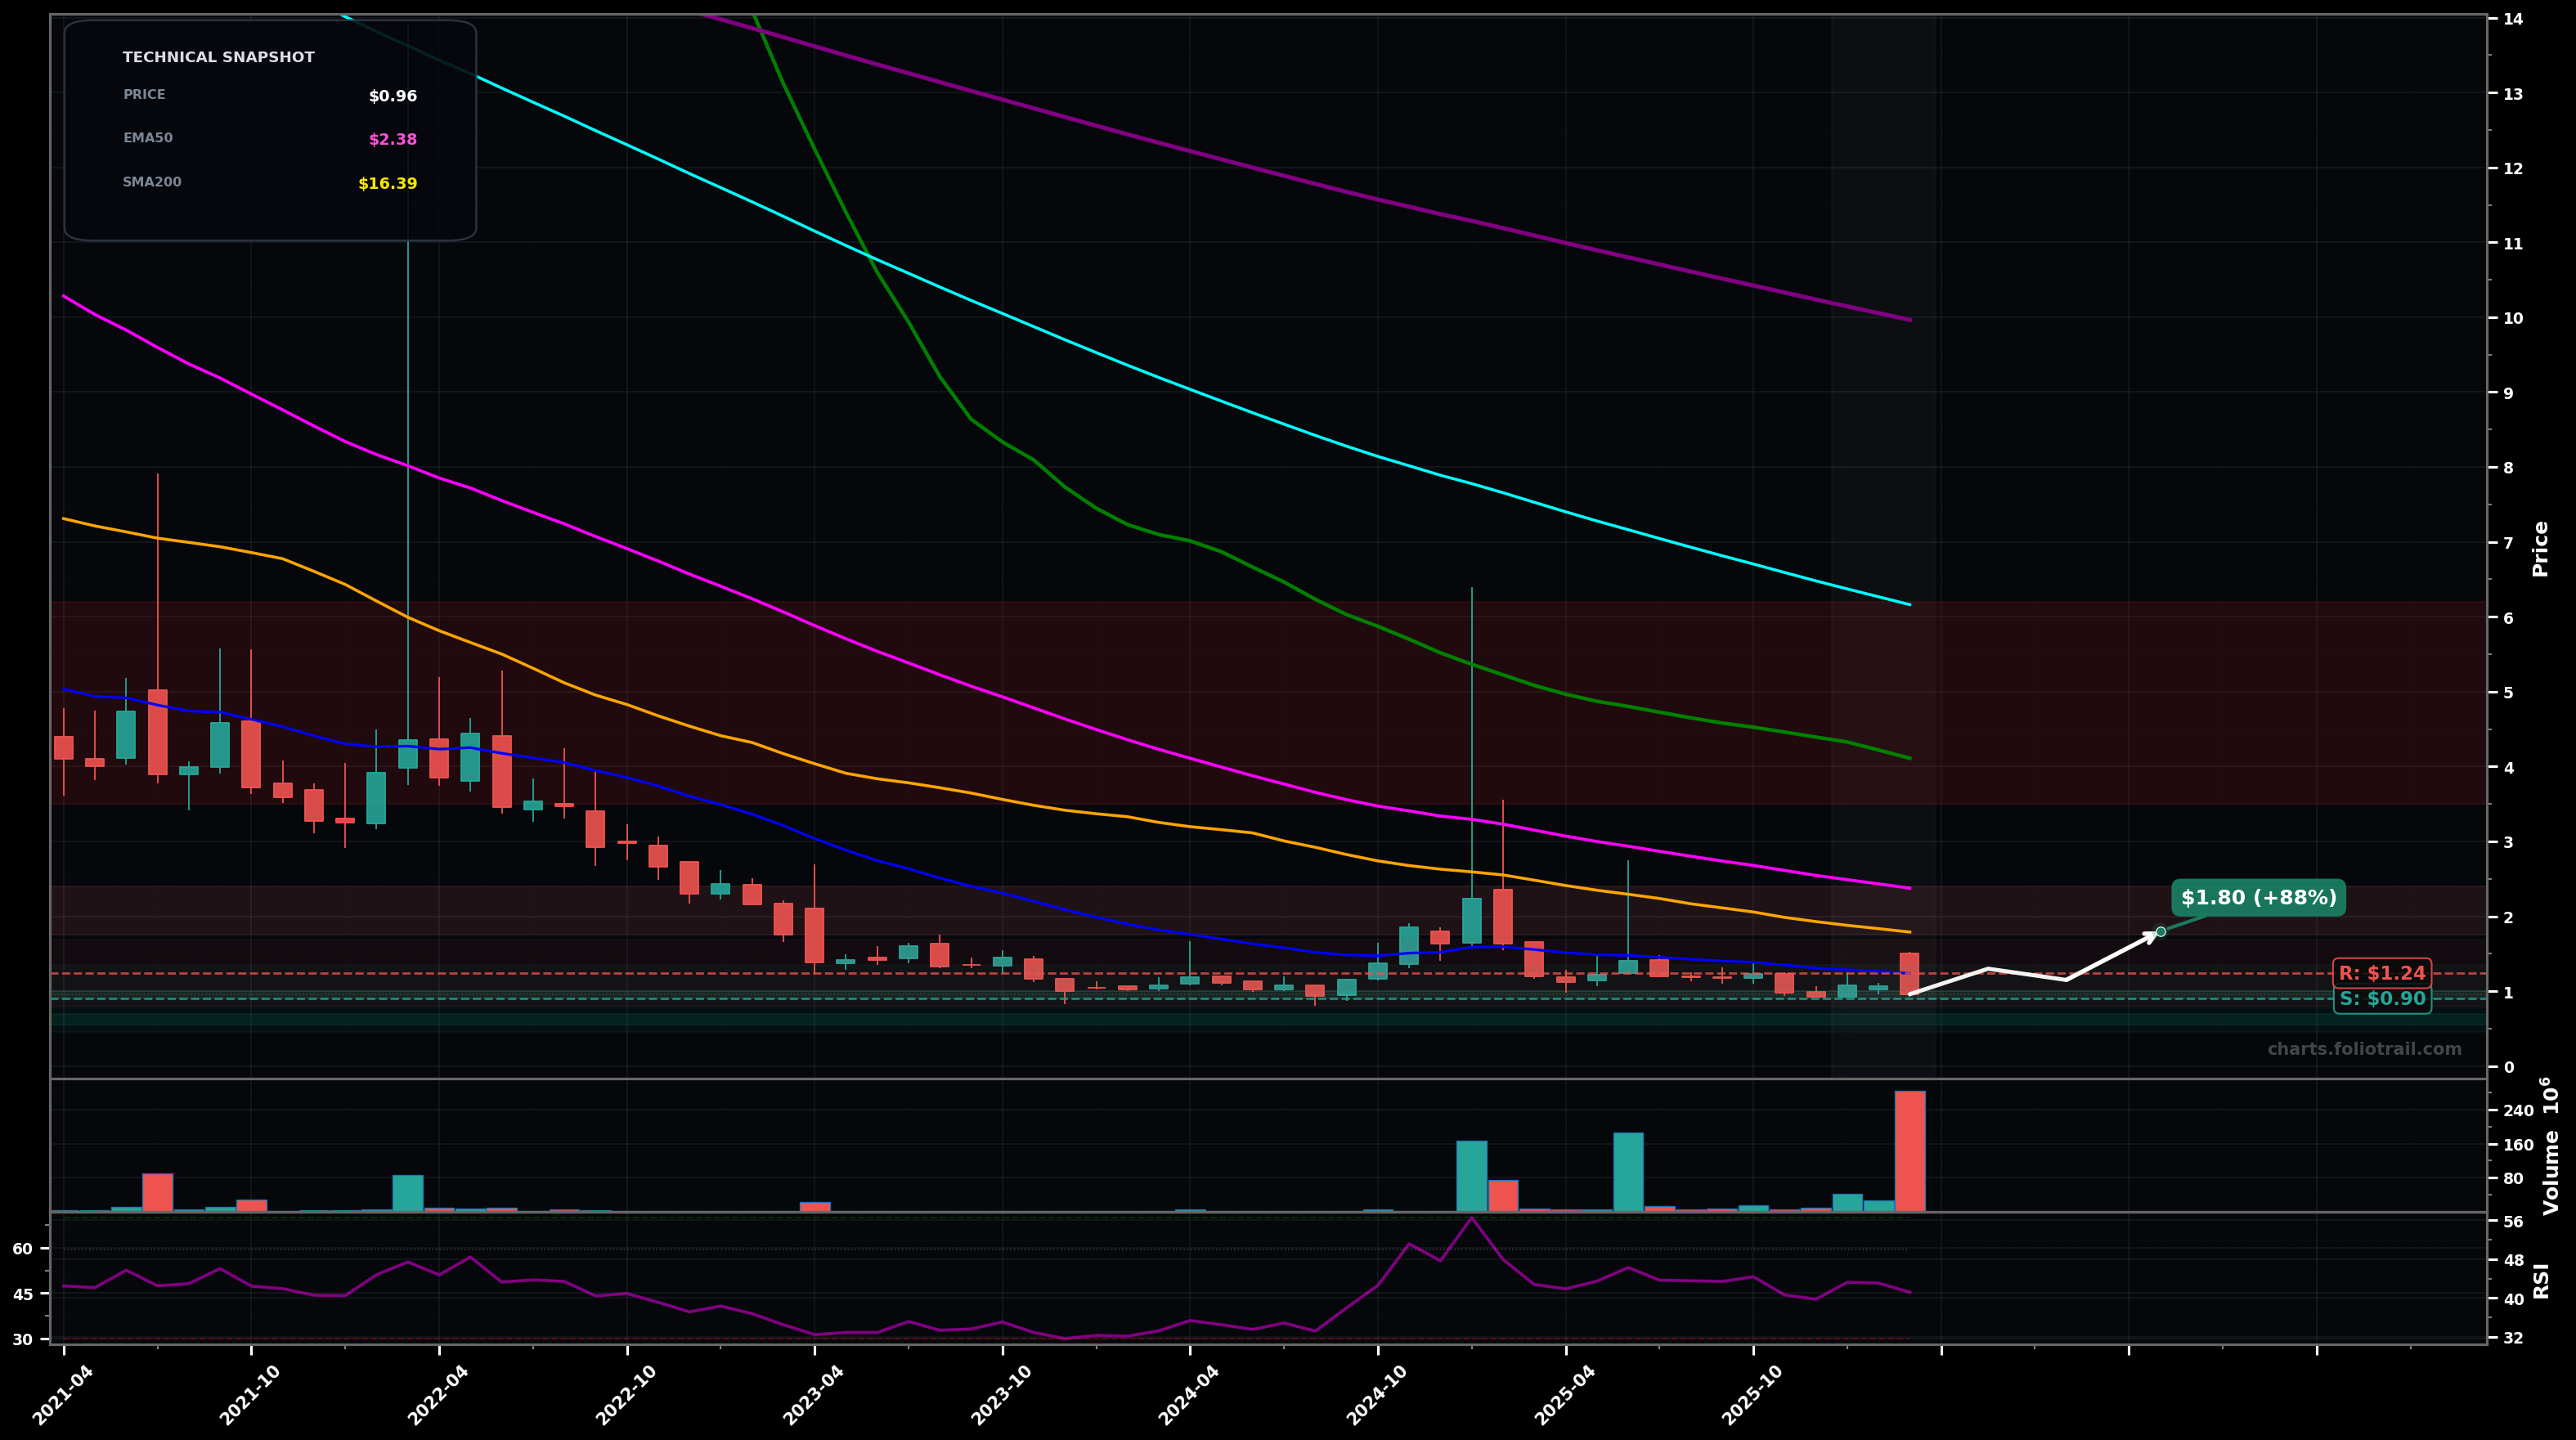
As of March 24, 2026, USEG (U.S. Energy Corp.) is in a bottoming attempt state on the monthly chart, with a confidence level of 58%. Key support is at $0.90 and key resistance at $1.24. Monthly price is compressing near ~$1 after a long multi-year selloff; last candle is a red push on elevated volume, still capped under the falling short/mid MAs.
Base holds and price grinds higher (wave (1) attempt off the lows) with a reclaim of EMA20; next it tests the first heavy overhead cluster (SMA50/EMA50 zone).
Support fails and the downtrend resumes (wave (5) extension), likely driven by a large red close near lows and follow-through.
2+ monthly closes back above the EMA20 (~$1.24) and then a hold above ~$1.30
Monthly close below ~$0.85
Start near the multi-month floor (~$0.90-$1.00); add on a flush to prior swing support; heavy add only if capitulation pushes into the next demand pocket while keeping risk defined under the breakdown level.
Trim into the first major MA/structure supply (SMA50/EMA50 then SMA100) and close into larger mean-reversion zones toward EMA100/cyan (~$6+) where prior breakdown supply is likely strongest.
As of March 24, 2026, USEG (U.S. Energy Corp.) is in a bottoming attempt state on the monthly chart with 58% confidence. Monthly price is compressing near ~$1 after a long multi-year selloff; last candle is a red push on elevated volume, still capped under the falling short/mid MAs.
On the monthly timeframe, USEG has key support at $0.90 and key resistance at $1.24. The most likely scenario (bullish) targets $1.30 and $1.80, with a revert level at $1.15.
USEG (U.S. Energy Corp.) is currently classified as bottoming attempt on the monthly chart, with 58% confidence. Confirmation requires: 2+ monthly closes back above the EMA20 (~$1.24) and then a hold above ~$1.30 This would be invalidated by: Monthly close below ~$0.85
The most likely scenario (bullish) targets $1.30 and $1.80, with a revert level at $1.15. The alternative scenario (bearish) targets $0.75 and $0.55.
All content on this website — including charts, analysis, price targets, support/resistance levels, and position zones — is generated entirely by AI and provided for educational and informational purposes only.
This is not financial advice. NEXUSNOIR VENTURES SL (the operator of this website) is not a registered investment adviser or broker-dealer. You should not make investment decisions based solely on this information. Always do your own research and consult a qualified financial advisor.
By continuing, you acknowledge that you have read and agree to our full disclaimer & terms of use and privacy policy.