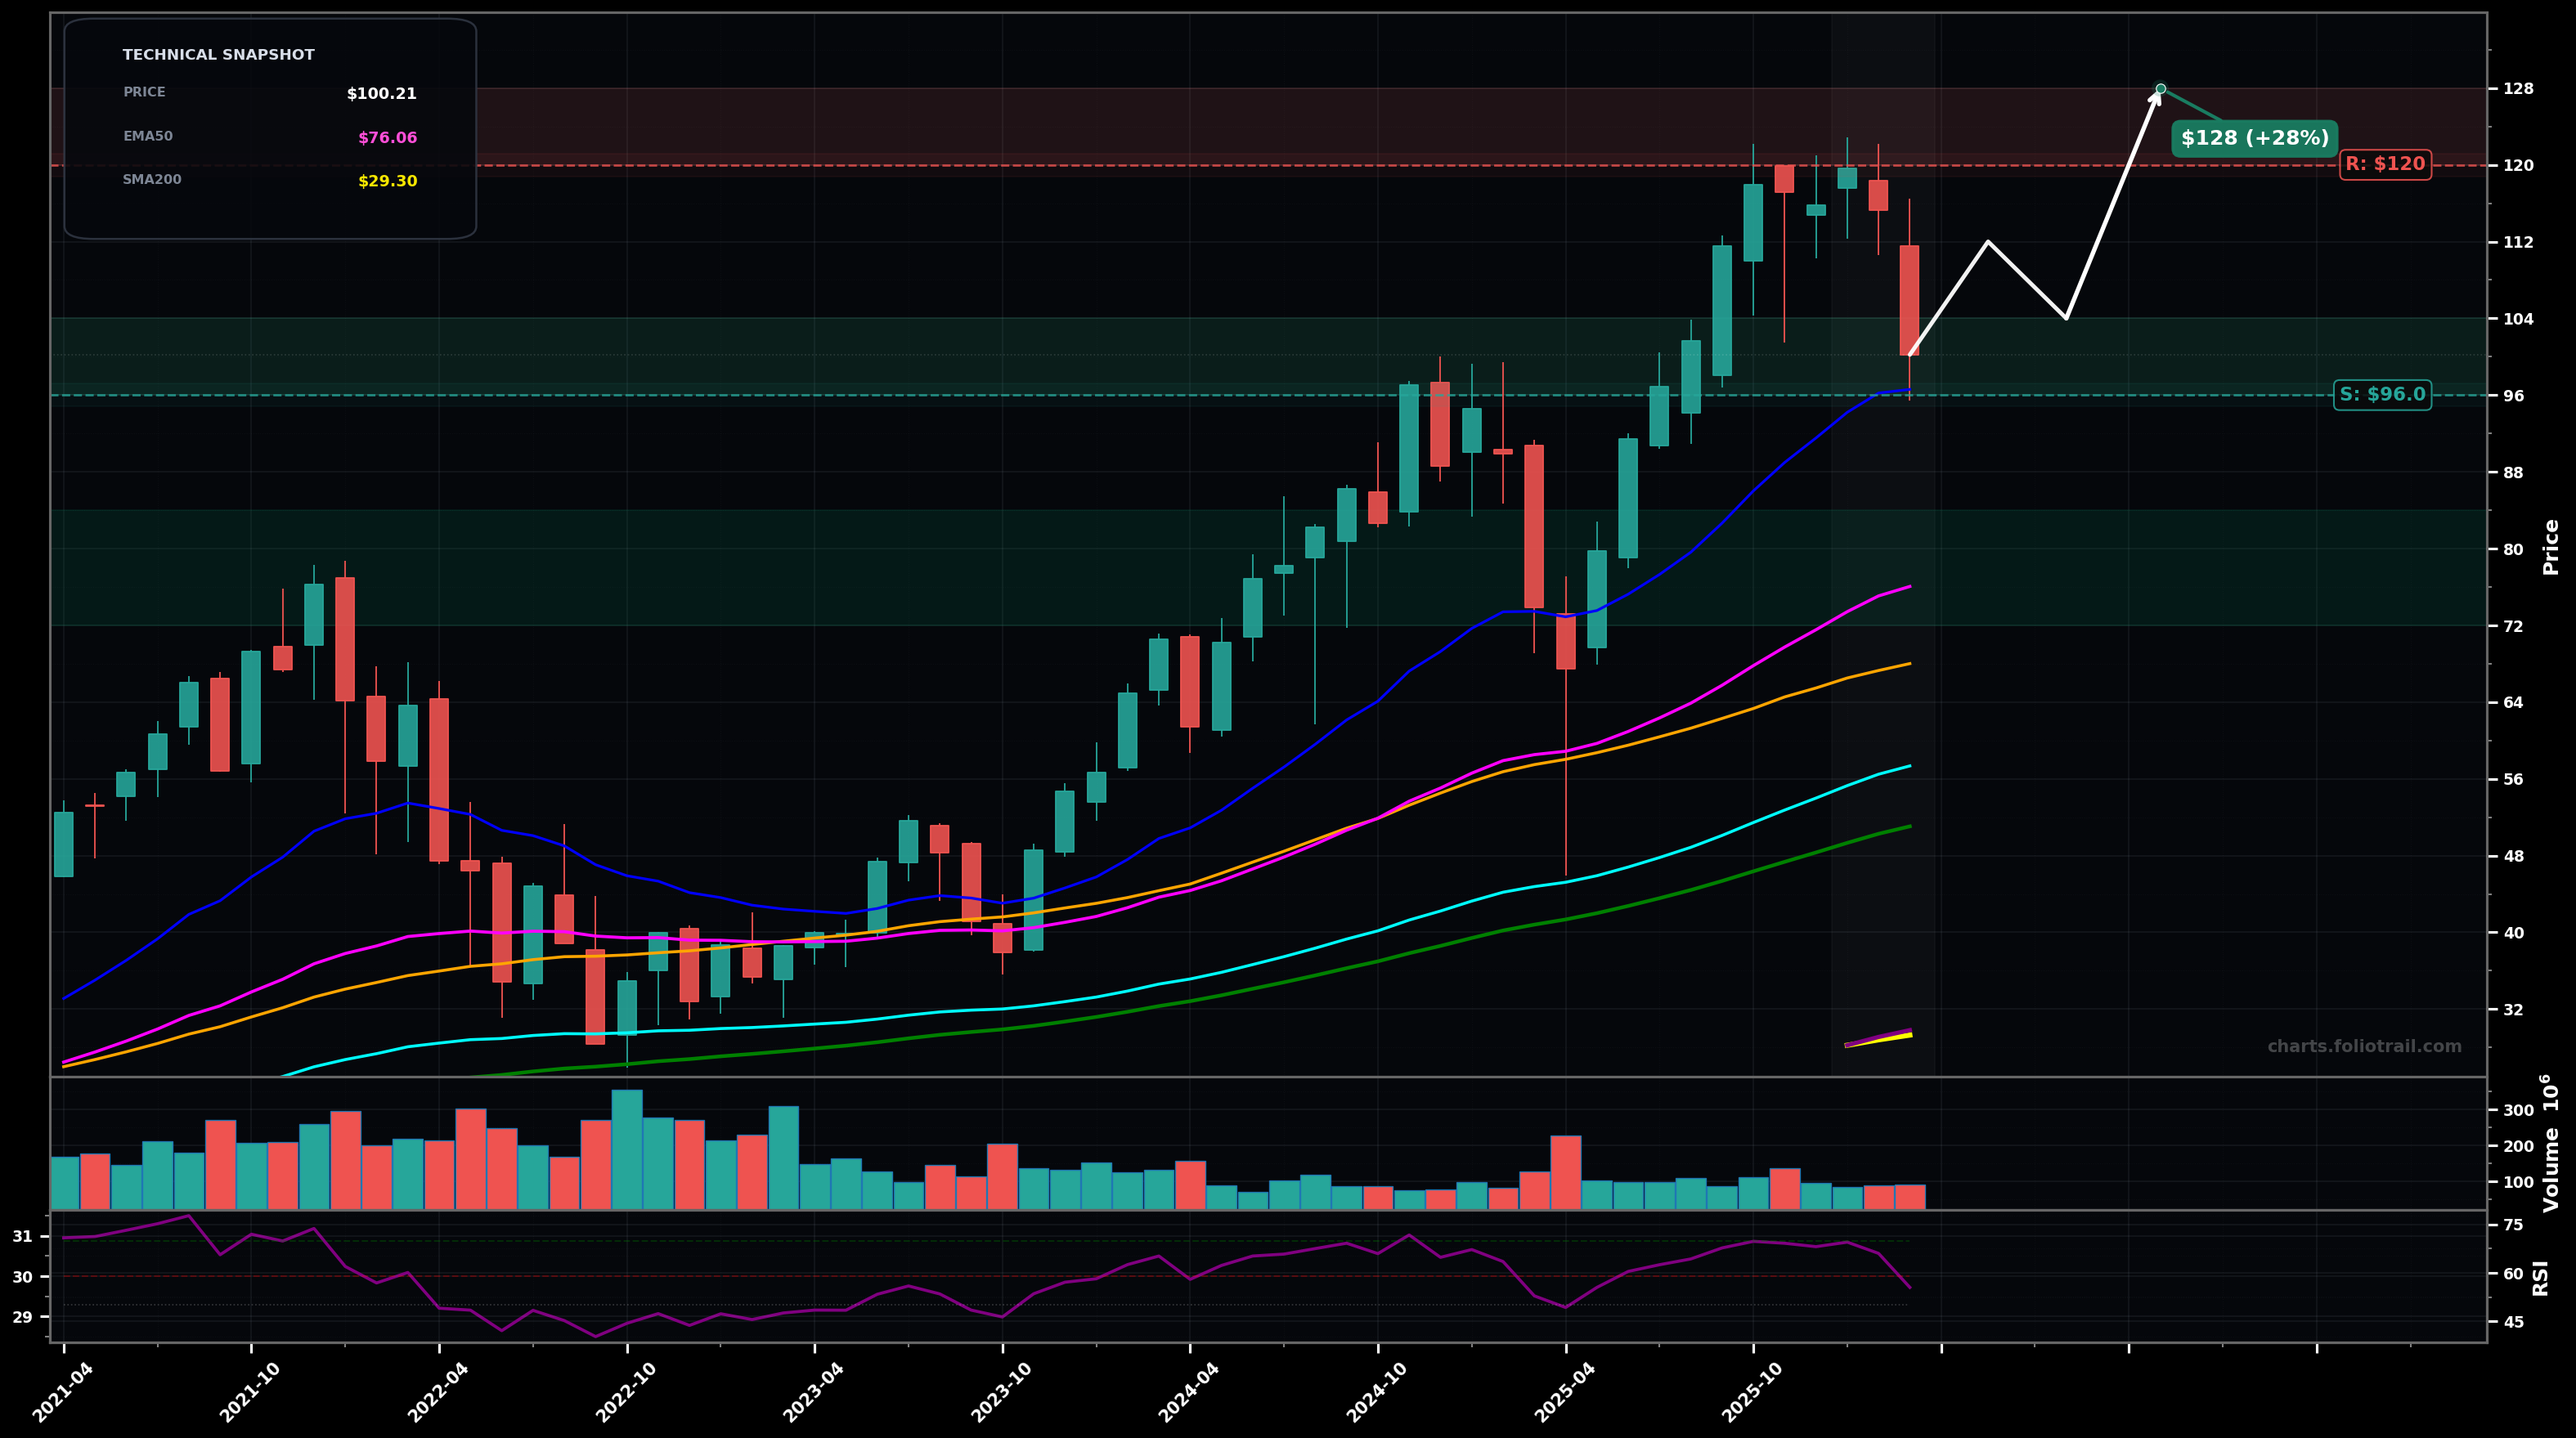
As of March 24, 2026, UPRO (ProShares UltraPro S&P500) is in a uptrend state on the monthly chart, with a confidence level of 68%. Key support is at $96.0 and key resistance at $120. After a strong multi-month advance to new highs near $120, price pulled back with a sharp red month to ~$100 while still holding well above rising EMA50/EMA100.
Bullish continuation: pullback resolves as a Wave 4-style consolidation, then price trends back toward the prior high and attempts a breakout (Wave 5 extension).
Bearish deeper correction: a larger ABC / Wave 4 expands, breaking below the recent swing support and mean-reverting toward the rising EMA50 before stabilizing.
Monthly close back above $112 would confirm continuation of the uptrend after the pullback.
Monthly close below $96 would shift bias to a deeper corrective phase (loss of key breakout/20EMA area).
Start near the $96 swing-low/20EMA area; add on deeper mean reversion toward the prior breakout zone; heavy add aligns with EMA50 (pink) ~$76 and typical 38.2–50% retrace of the $40→$120 impulse.
Trim into prior-high retest and breakout attempts; larger trims if Wave 5 extends and price stretches far above EMA50/EMA100; full close only on an outsized multi-year extension where monthly distance to trend MAs becomes extreme.
As of March 24, 2026, UPRO (ProShares UltraPro S&P500) is in a uptrend state on the monthly chart with 68% confidence. After a strong multi-month advance to new highs near $120, price pulled back with a sharp red month to ~$100 while still holding well above rising EMA50/EMA100.
On the monthly timeframe, UPRO has key support at $96.0 and key resistance at $120. The most likely scenario (bullish) targets $112 and $128, with a revert level at $104.
UPRO (ProShares UltraPro S&P500) is currently classified as uptrend on the monthly chart, with 68% confidence. Confirmation requires: Monthly close back above $112 would confirm continuation of the uptrend after the pullback. This would be invalidated by: Monthly close below $96 would shift bias to a deeper corrective phase (loss of key breakout/20EMA area).
The most likely scenario (bullish) targets $112 and $128, with a revert level at $104. The alternative scenario (bearish) targets $96.0 and $78.0.
All content on this website — including charts, analysis, price targets, support/resistance levels, and position zones — is generated entirely by AI and provided for educational and informational purposes only.
This is not financial advice. NEXUSNOIR VENTURES SL (the operator of this website) is not a registered investment adviser or broker-dealer. You should not make investment decisions based solely on this information. Always do your own research and consult a qualified financial advisor.
By continuing, you acknowledge that you have read and agree to our full disclaimer & terms of use and privacy policy.