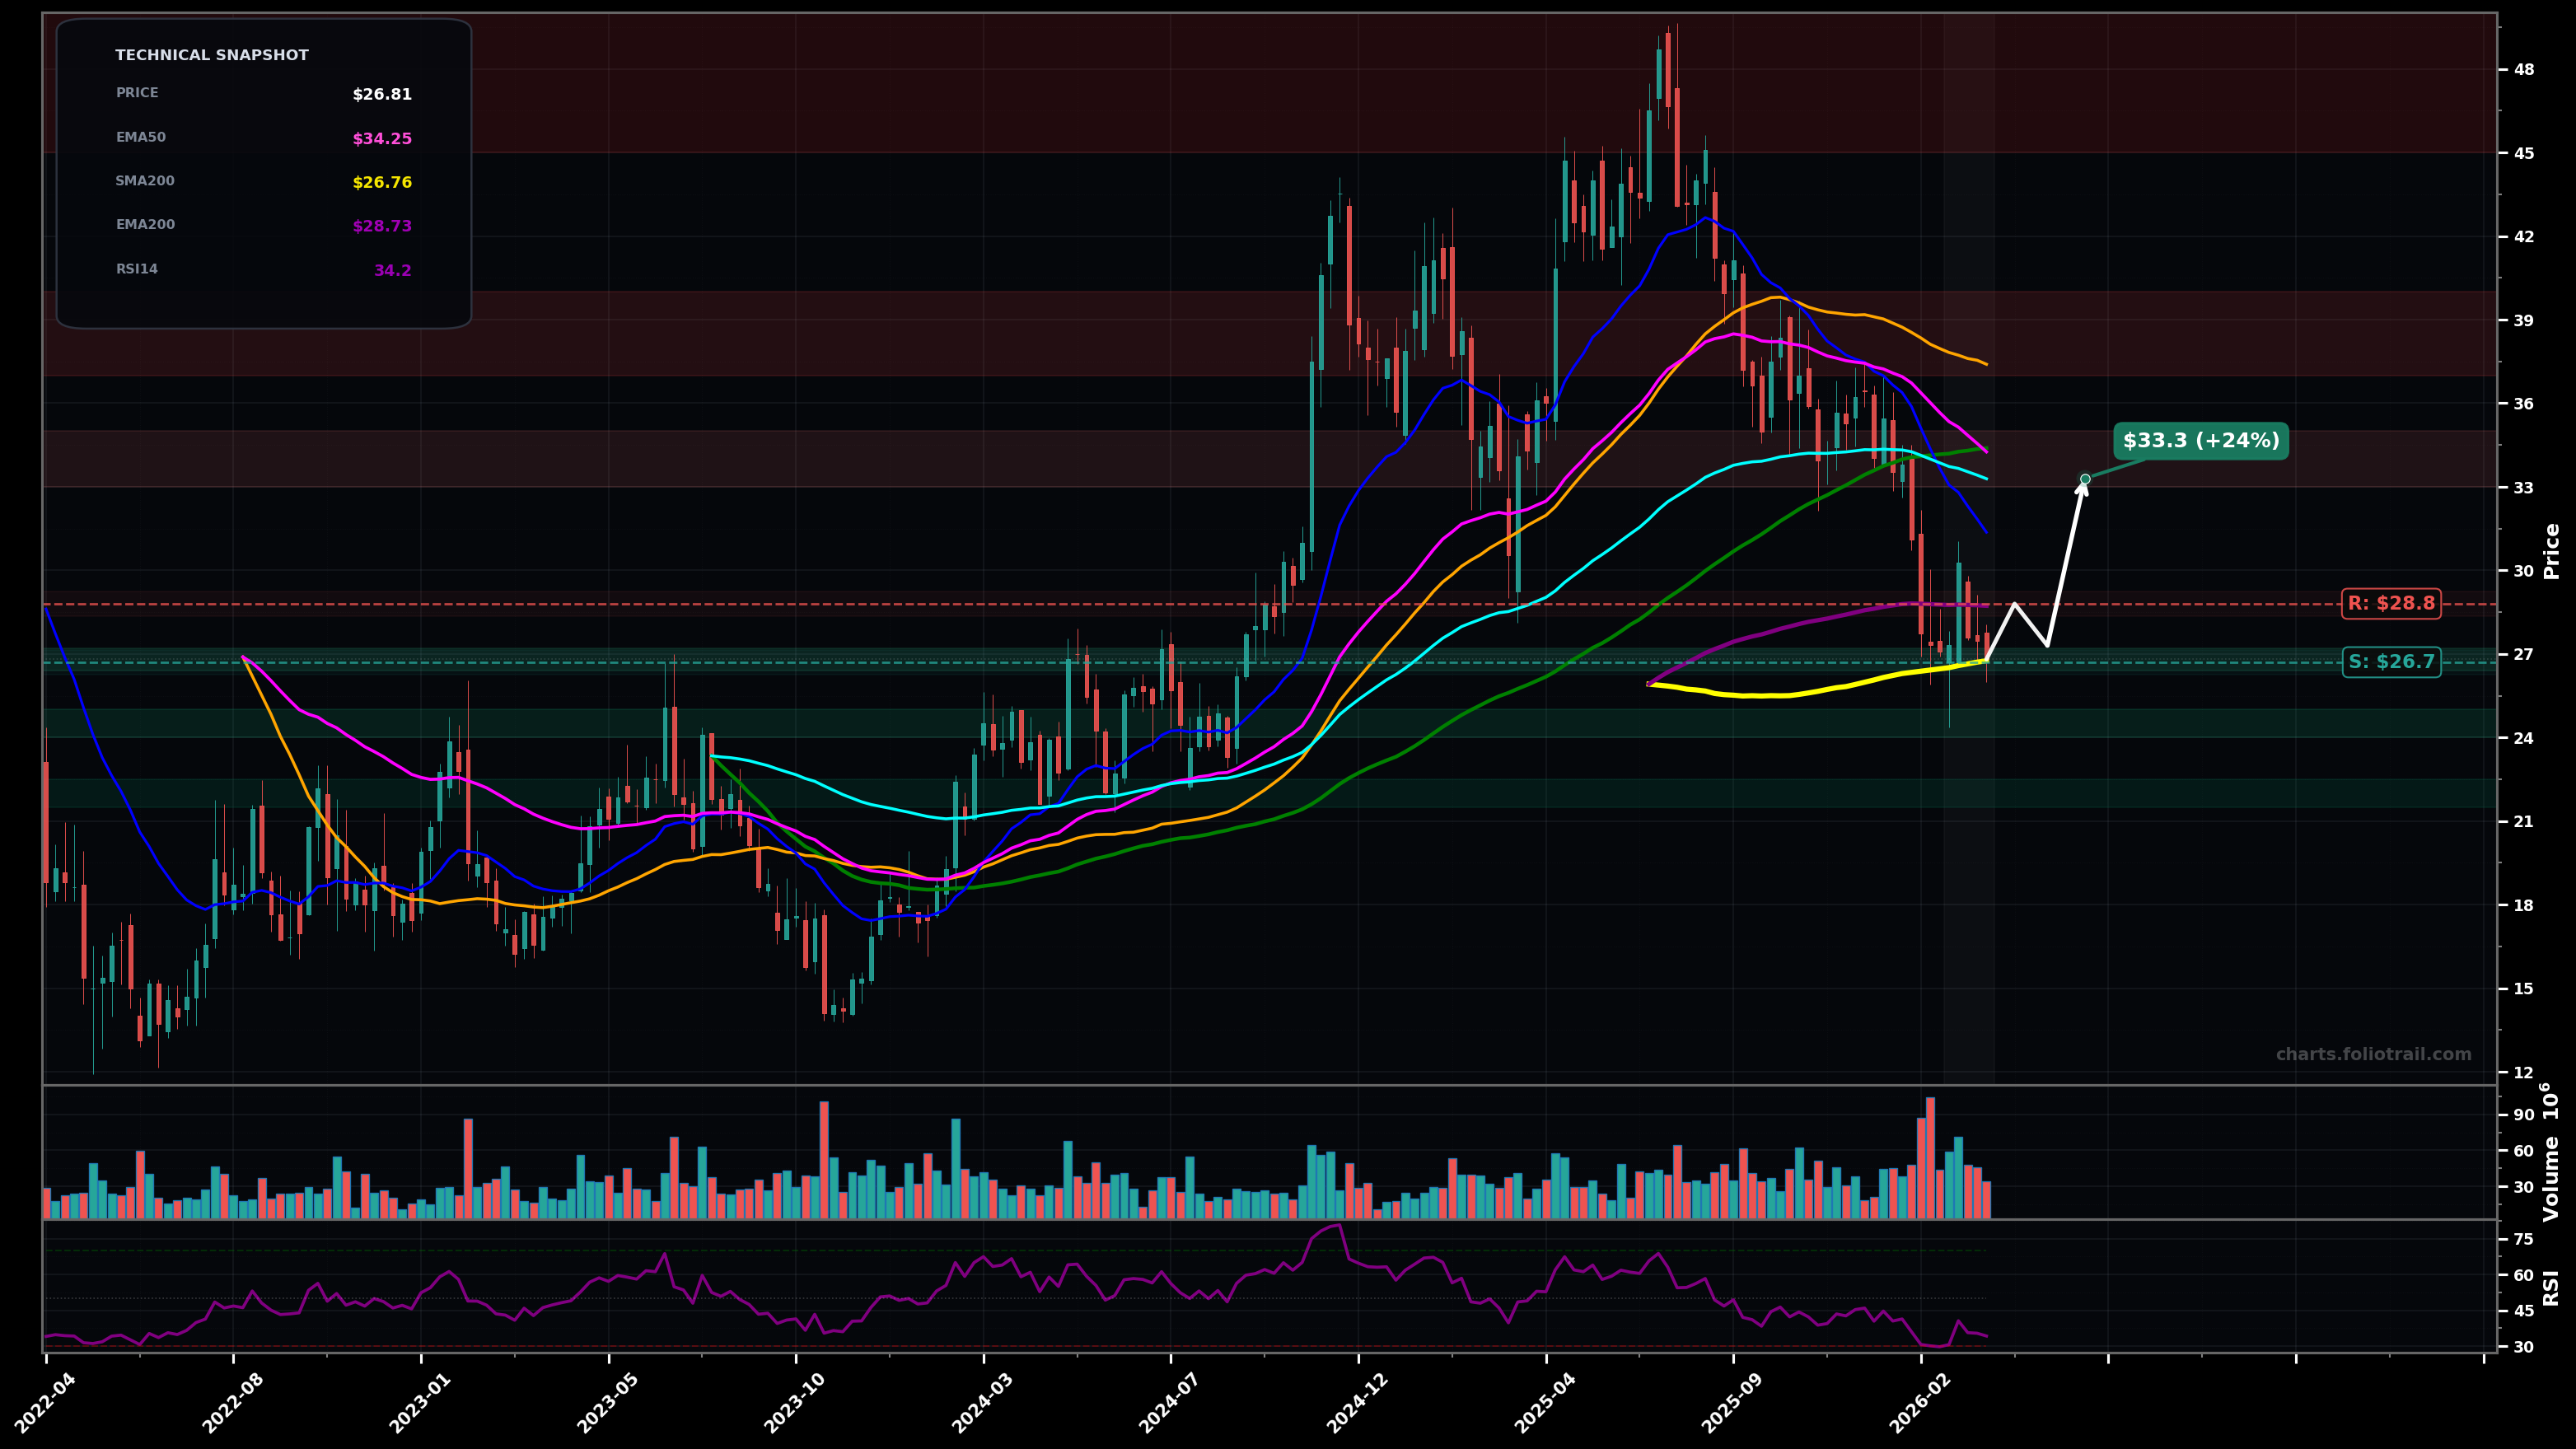
As of March 26, 2026, TOST (Toast Inc.) is in a falling knife state on the weekly chart, with a confidence level of 67%. Key support is at $26.7 and key resistance at $28.8. Weekly downtrend persists; price ~$26.81 is sitting on the $26.7–$27.0 base (SMA200/EMA200 cluster) after a sharp selloff from the ~$49 peak; RSI14 ~34 (weak momentum).
Base-at-200s: price holds $26.7 area, forms a higher low on the weekly, then mean-reverts toward the first moving-average supply (EMA200/nearby pivots) before a bigger decision.
Continuation flush: a decisive weekly close under the $26.7 shelf triggers a stop-run toward the next demand band (prior consolidation + measured move), with a reflex bounce possible but trend remains down unless reclaimed quickly.
Weekly close below $26.50 (clean loss of the SMA200 ~$26.76 / structure shelf).
Two weekly closes back above $31.40 (reclaim EMA20 ~$31.36 and hold).
Layer bids at the SMA200/EMA200 confluence first, add on breakdown-to-next-demand, heavy add only at deeper weekly support where a capitulation wick/RSI divergence is more likely.
Trim into the first MA-supply zones (EMA100/EMA50/SMA50 area) and close into the prior major distribution/top region where upside becomes structurally crowded.
As of March 26, 2026, TOST (Toast Inc.) is in a falling knife state on the weekly chart with 67% confidence. Weekly downtrend persists; price ~$26.81 is sitting on the $26.7–$27.0 base (SMA200/EMA200 cluster) after a sharp selloff from the ~$49 peak; RSI14 ~34 (weak momentum).
On the weekly timeframe, TOST has key support at $26.7 and key resistance at $28.8. The most likely scenario (bullish) targets $28.8 and $33.3, with a revert level at $27.3.
TOST (Toast Inc.) is currently classified as falling knife on the weekly chart, with 67% confidence. Confirmation requires: Weekly close below $26.50 (clean loss of the SMA200 ~$26.76 / structure shelf). This would be invalidated by: Two weekly closes back above $31.40 (reclaim EMA20 ~$31.36 and hold).
The most likely scenario (bullish) targets $28.8 and $33.3, with a revert level at $27.3. The alternative scenario (bearish) targets $24.0 and $21.5.
Multi-layer AI agents analyse 200+ stocks across daily, weekly, and monthly timeframes — producing market state classifications, price scenarios with targets, and position entry/exit levels. Updated every trading day after market close. No paywall. No sign-up required.
Built by Foliotrail.
All content on this website — including charts, analysis, price targets, support/resistance levels, and position zones — is generated entirely by AI and provided for educational and informational purposes only.
This is not financial advice. NEXUSNOIR VENTURES SL (the operator of this website) is not a registered investment adviser or broker-dealer. You should not make investment decisions based solely on this information. Always do your own research and consult a qualified financial advisor.
By continuing, you acknowledge that you have read and agree to our full disclaimer & terms of use and privacy policy.