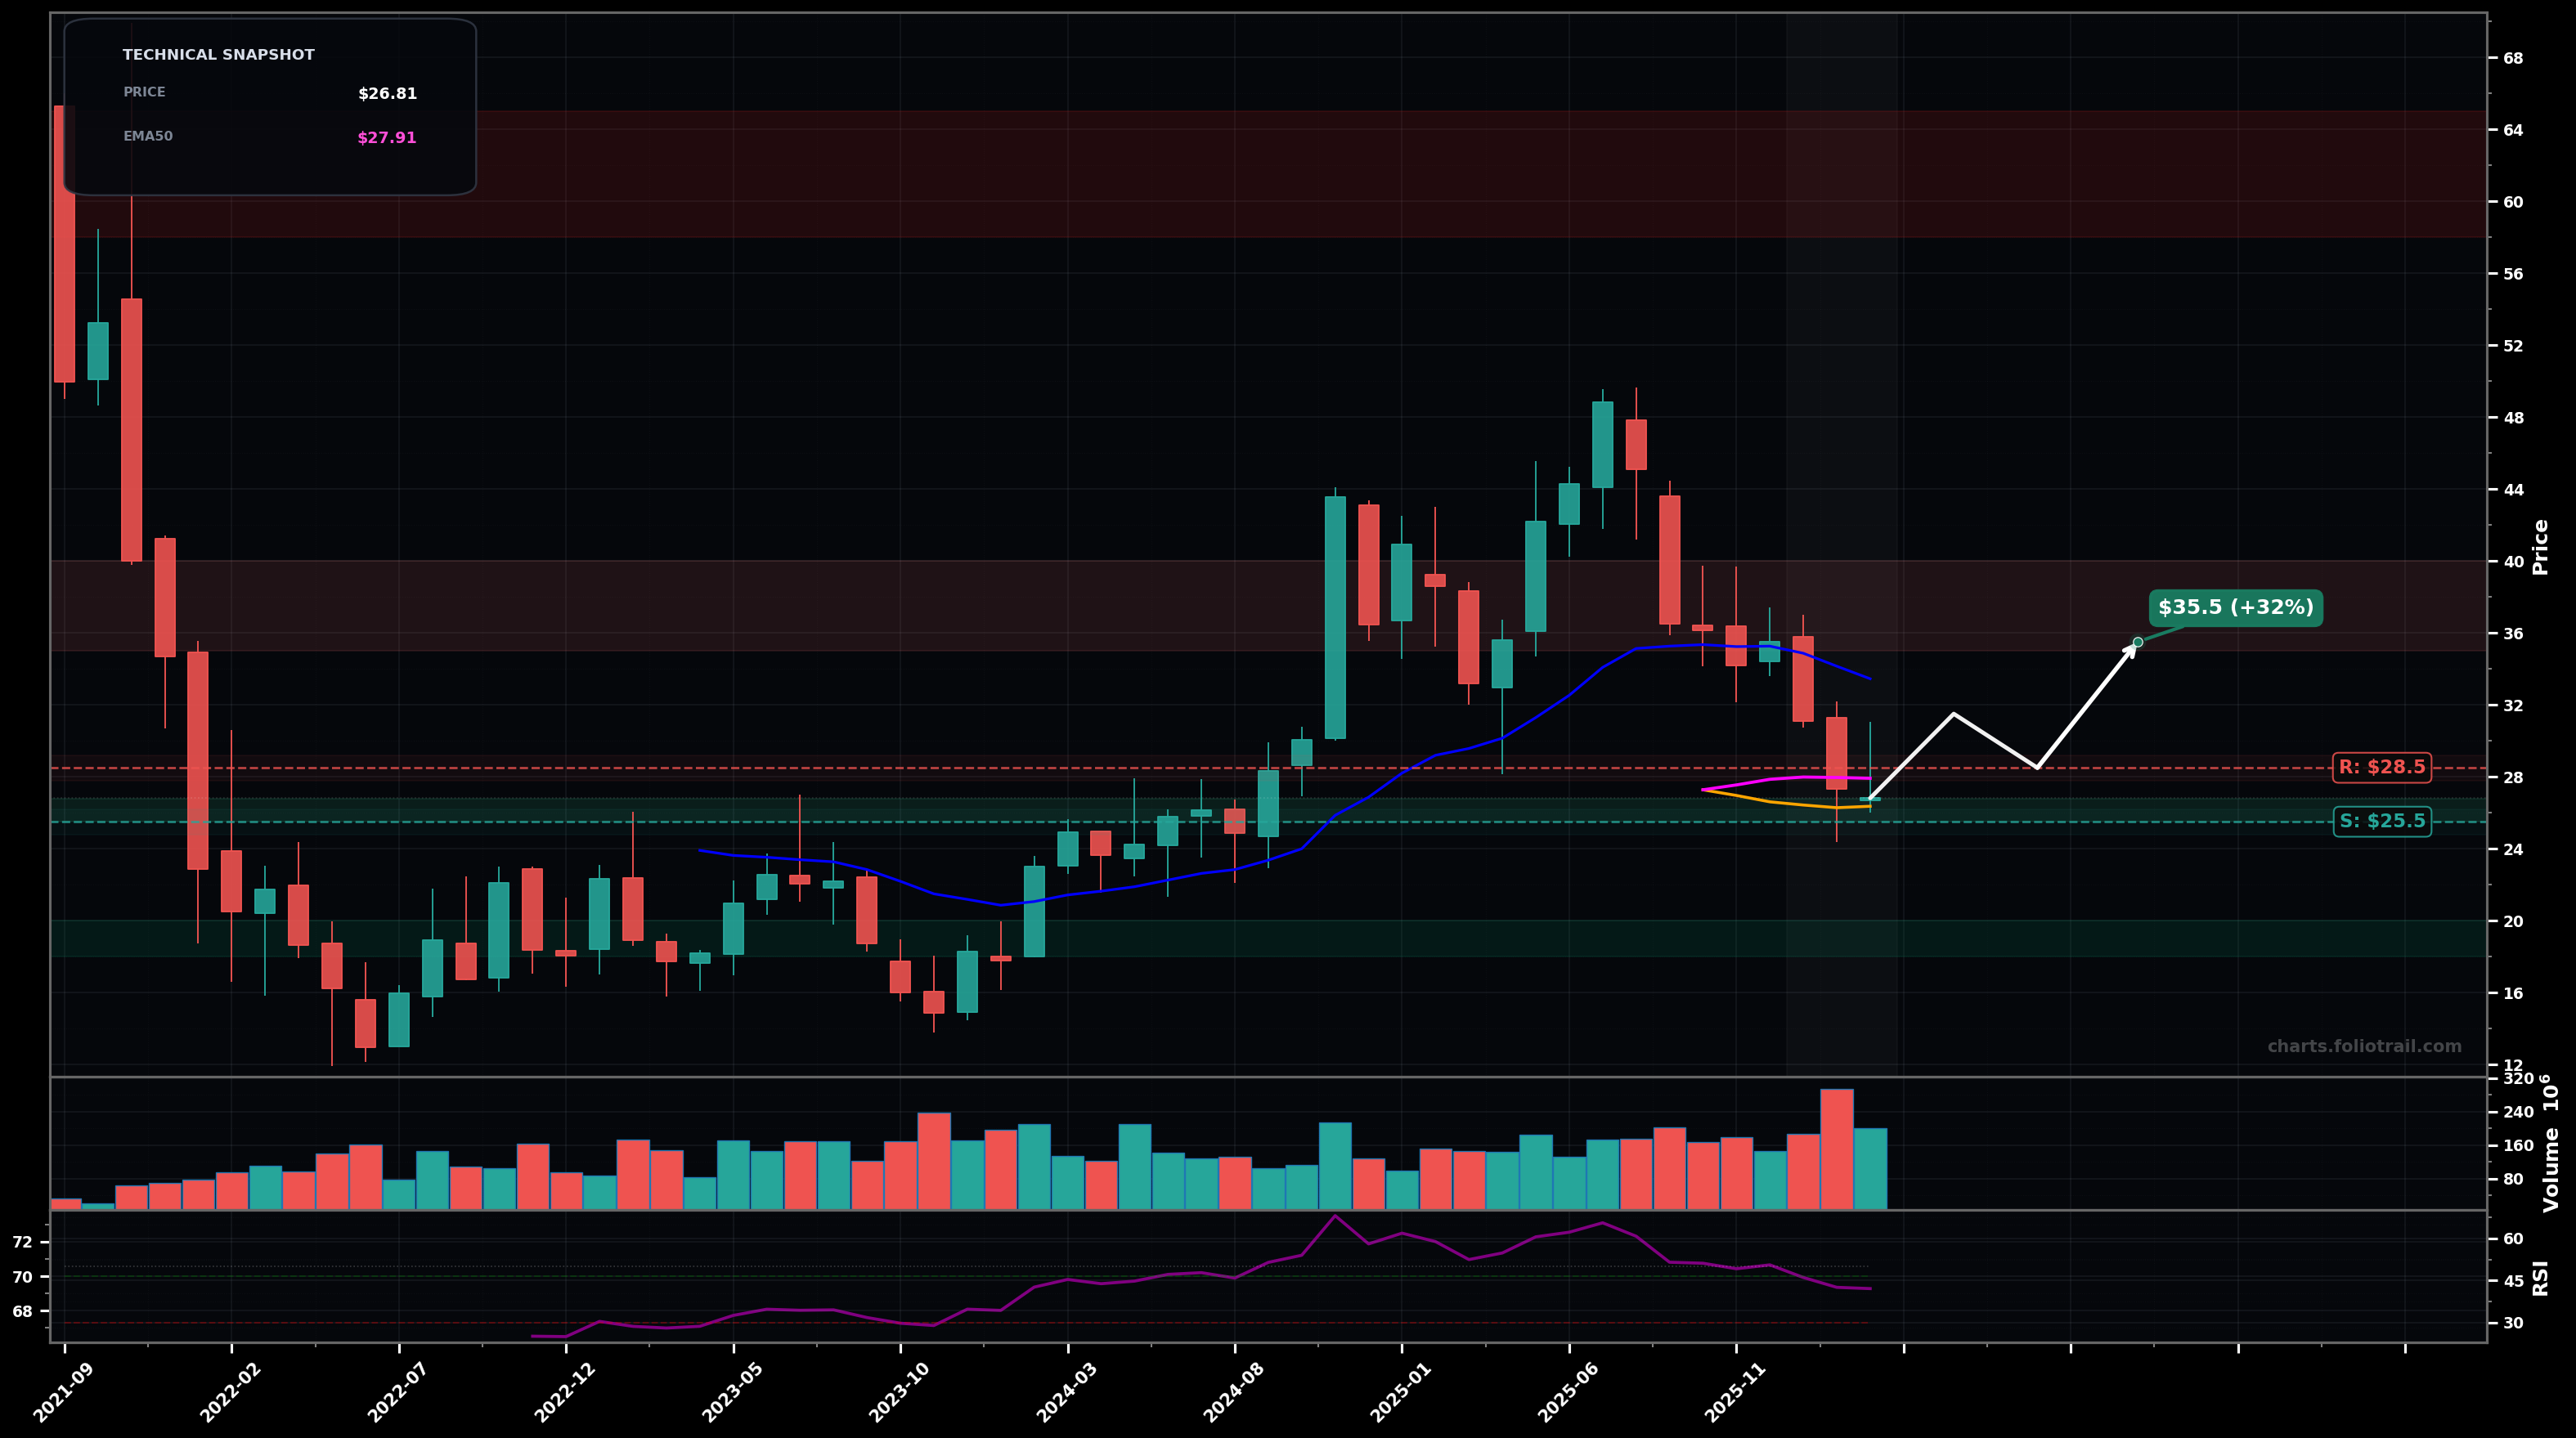
As of April 30, 2026, TOST (Toast Inc.) is in a downtrend state on the monthly chart, with a confidence level of 66%. Key support is at $25.5 and key resistance at $33.0. Monthly down-leg paused with a small green bounce after printing a swing low near the mid-$20s; price ($28.51) still below EMA50 ($32.51) and EMA100 ($32.97) while SMA50 ($26.51) is acting as near-term support.
Base-building bounce: price holds $25.50 support, grinds up into the $32–$33 EMA cluster; if accepted above, a larger mean-reversion rally targets the prior breakdown area.
Trend continuation: rejection at the $32–$33 EMA cluster leads to a rollover; loss of $25.50 opens a flush to the next demand zone (prior base/round-number support).
Monthly close below $25.50 (break of the most recent swing low) would confirm continuation lower
Two consecutive monthly closes above $33.50 (reclaim/hold over EMA50+EMA100 zone) would invalidate the downtrend bias
Layer bids around the swing-low support ($25.5) and prior base; heavier adds only if a deeper capitulation/discount prints toward the next major support (~$20–$23.5).
Trim into prior supply from the 2025 distribution (~$40–$55) and fully exit if price becomes extended into the old monthly top zone (~$60+).
As of April 30, 2026, TOST (Toast Inc.) is in a downtrend state on the monthly chart with 66% confidence. Monthly down-leg paused with a small green bounce after printing a swing low near the mid-$20s; price ($28.51) still below EMA50 ($32.51) and EMA100 ($32.97) while SMA50 ($26.51) is acting as near-term support.
On the monthly timeframe, TOST has key support at $25.5 and key resistance at $33.0. The most likely scenario (bullish) targets $33.0 and $40.0, with a revert level at $30.5.
TOST (Toast Inc.) is currently classified as downtrend on the monthly chart, with 66% confidence. Confirmation requires: Monthly close below $25.50 (break of the most recent swing low) would confirm continuation lower This would be invalidated by: Two consecutive monthly closes above $33.50 (reclaim/hold over EMA50+EMA100 zone) would invalidate the downtrend bias
The most likely scenario (bullish) targets $33.0 and $40.0, with a revert level at $30.5. The alternative scenario (bearish) targets $24.0 and $20.0.
Multi-layer AI agents analyse 200+ stocks across daily, weekly, and monthly timeframes — producing market state classifications, price scenarios with targets, and position entry/exit levels. Daily charts updated every trading day at 6 PM ET. Weekly charts refresh Fridays. Monthly charts refresh on the last trading day of each month. No paywall. No sign-up required.
Built by Foliotrail.
All content on this website — including charts, analysis, price targets, support/resistance levels, and position zones — is generated entirely by AI and provided for educational and informational purposes only.
This is not financial advice. NEXUSNOIR VENTURES SL (the operator of this website) is not a registered investment adviser or broker-dealer. You should not make investment decisions based solely on this information. Always do your own research and consult a qualified financial advisor.
By continuing, you acknowledge that you have read and agree to our full disclaimer & terms of use and privacy policy.