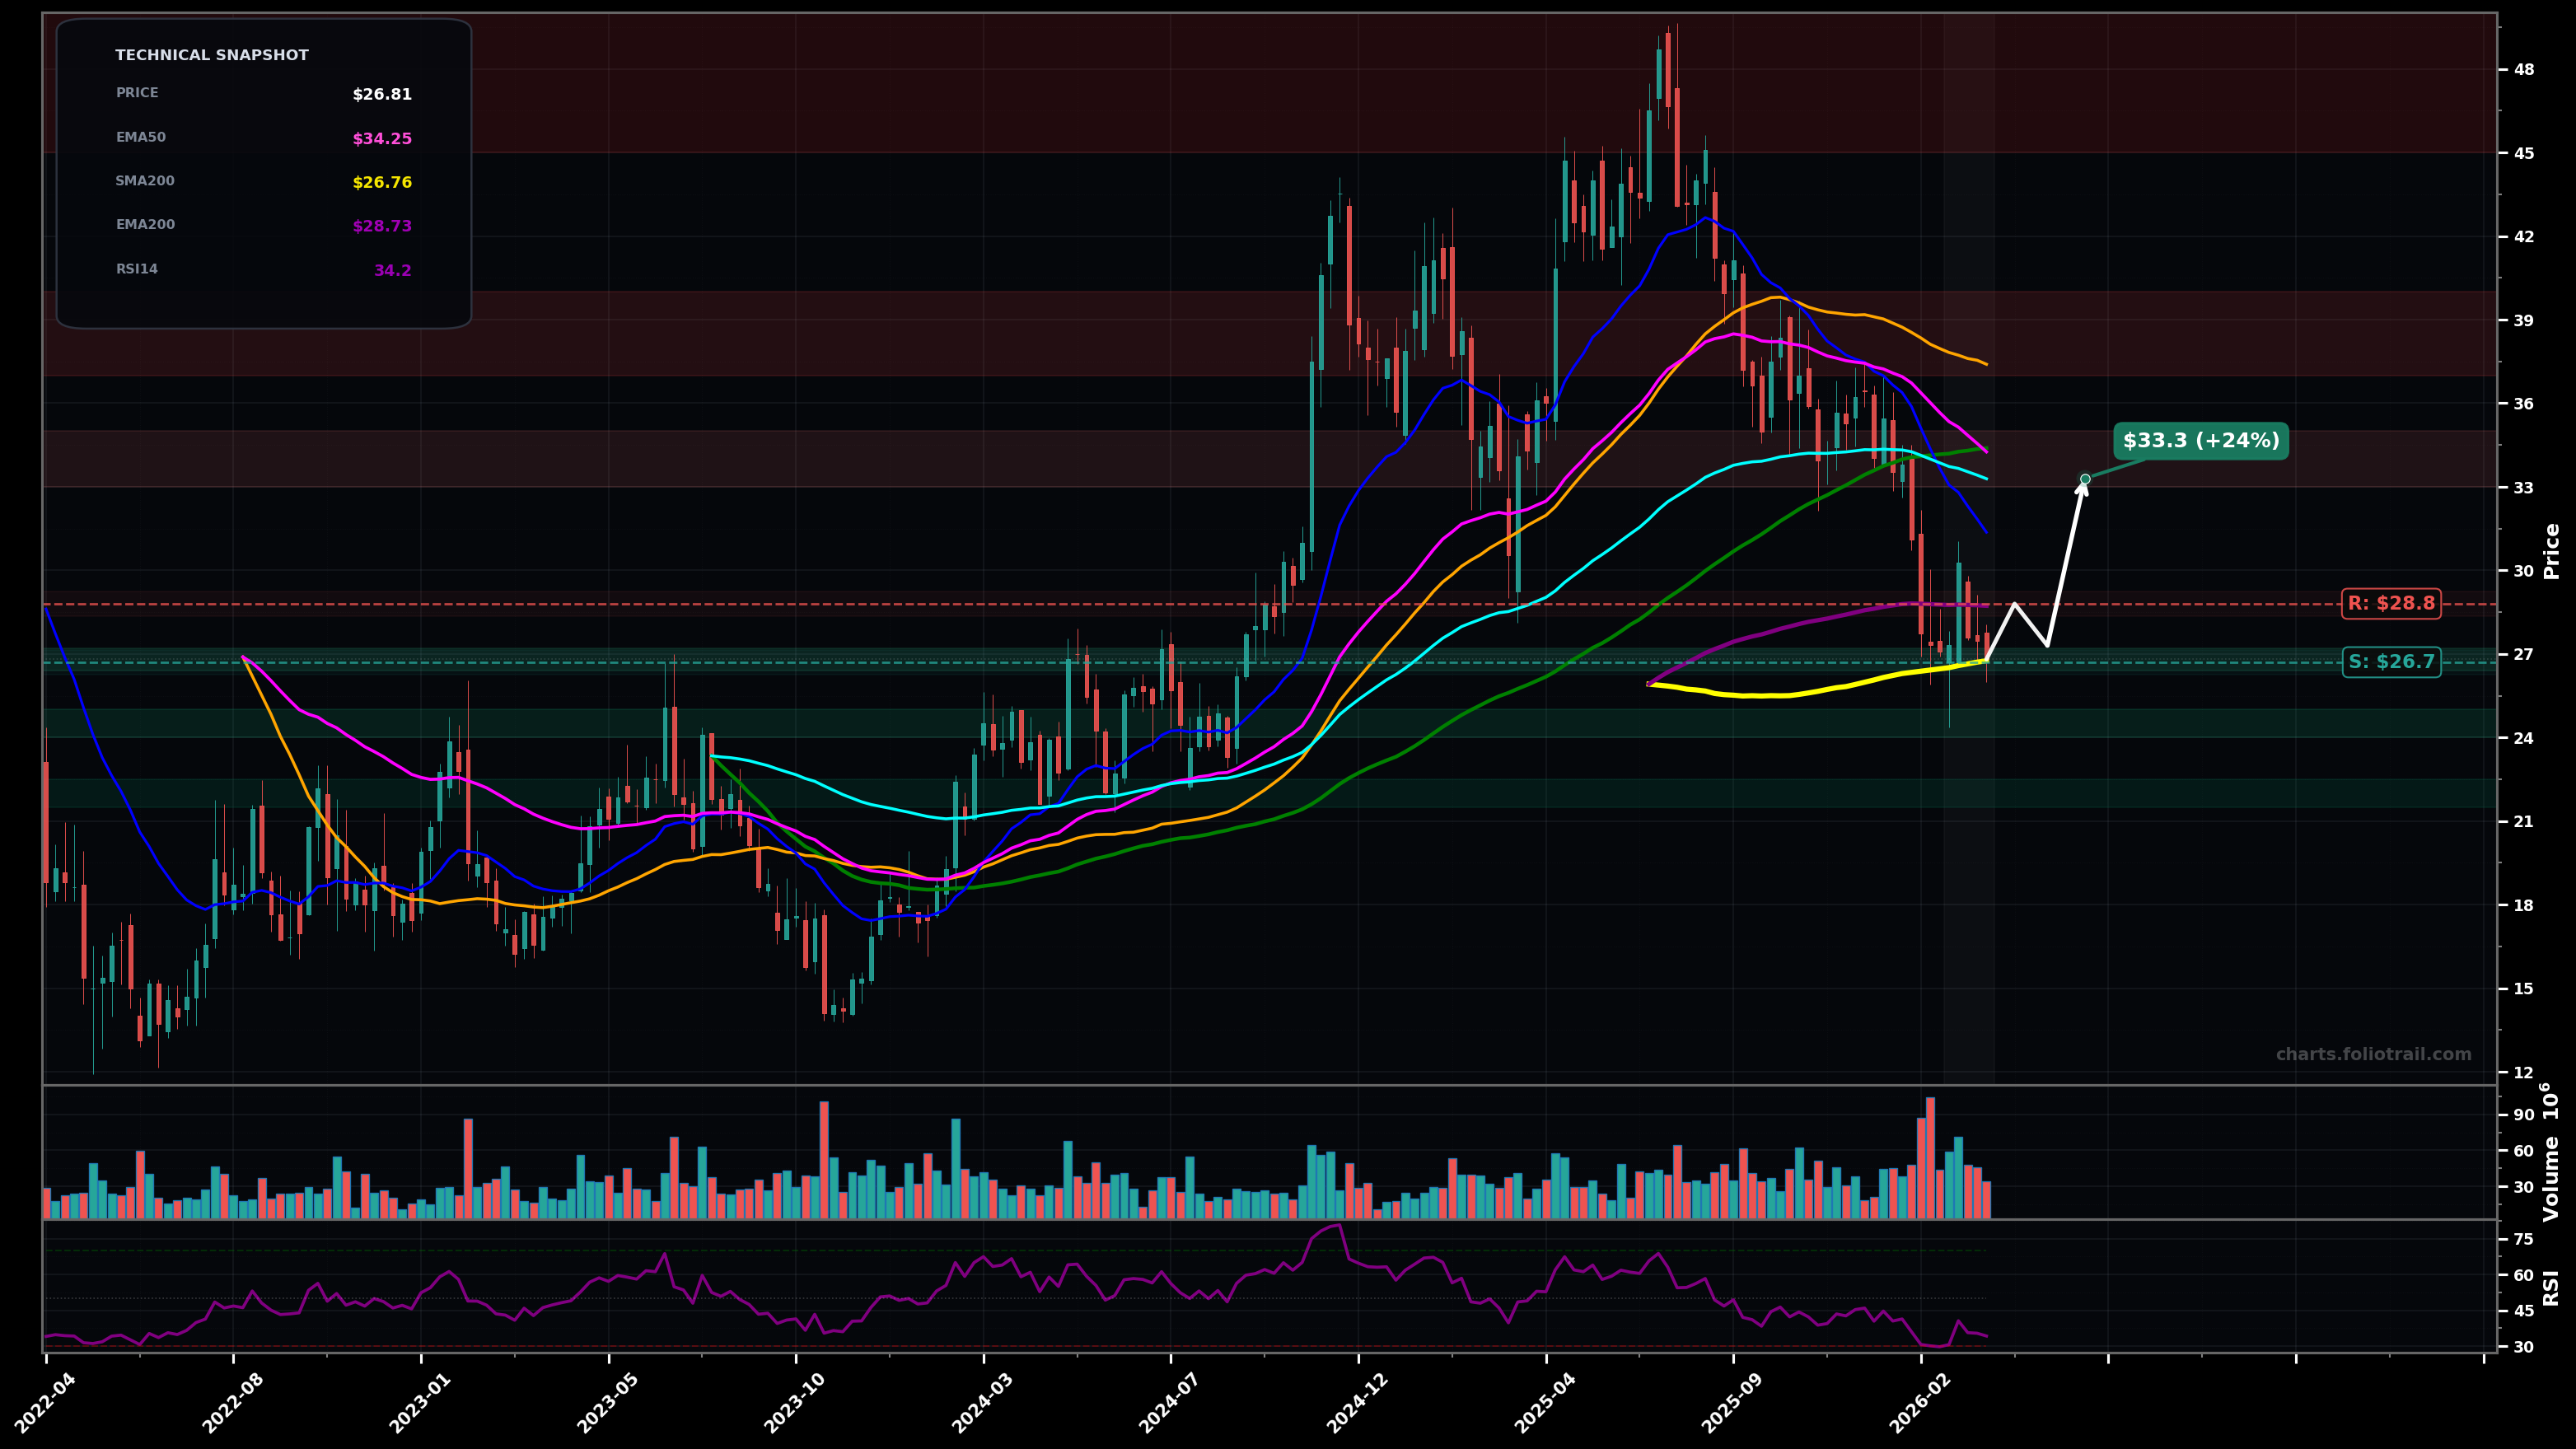
As of May 22, 2026, TOST (Toast Inc.) is in a falling knife state on the weekly chart, with a confidence level of 73%. Key support is at $22.5 and key resistance at $28.5. Weekly selloff broke below the $27-$28 zone (near SMA200) and price is now deeply below all key EMAs/SMAs; small bounce attempt with RSI~33 still weak.
Bear flag / weak bounce into resistance, then continuation lower as prior broken $27-$28 (SMA200 area) acts as supply; Elliott-wave read: likely still in an impulse down (wave 3/5) or extending C-wave; Fibonacci: bounce often caps near 0.382 retrace of the last leg down (roughly the upper-$20s/low-$30s).
Capitulation low forms (momentum divergence/failed breakdown), price builds a base and performs a breakout-reversal by reclaiming the $27-$28 area, then mean-reverts toward the EMA cluster (low-$30s). Elliott-wave alt: завершение wave 5 down (or C) then start of ABC corrective up.
Weekly close below $22.50 (new swing-low break) confirms continued FALLING_KNIFE
2+ weekly closes back above $28.50 (reclaim of $27-$28 breakdown zone) invalidates FALLING_KNIFE and shifts to bottoming/reversal risk
Scale only near/under the current swing-low support ($22-$23) and into deeper fib/psych support zones; trend is down so sizing assumes volatility + possible lower-low before any base.
Trim into mean-reversion and major overhead supply: EMA/MA cluster low-$30s first, then prior breakdown zones $39-$43, and fully exit near prior swing-high supply around the high-$40s.
As of May 22, 2026, TOST (Toast Inc.) is in a falling knife state on the weekly chart with 73% confidence. Weekly selloff broke below the $27-$28 zone (near SMA200) and price is now deeply below all key EMAs/SMAs; small bounce attempt with RSI~33 still weak.
On the weekly timeframe, TOST has key support at $22.5 and key resistance at $28.5. The most likely scenario (bearish) targets $21.0 and $18.0, with a revert level at $28.0.
TOST (Toast Inc.) is currently classified as falling knife on the weekly chart, with 73% confidence. Confirmation requires: Weekly close below $22.50 (new swing-low break) confirms continued FALLING_KNIFE This would be invalidated by: 2+ weekly closes back above $28.50 (reclaim of $27-$28 breakdown zone) invalidates FALLING_KNIFE and shifts to bottoming/reversal risk
The most likely scenario (bearish) targets $21.0 and $18.0, with a revert level at $28.0. The alternative scenario (bullish) targets $32.0 and $35.0.
Multi-layer AI agents analyse 200+ stocks across daily, weekly, and monthly timeframes — producing market state classifications, price scenarios with targets, and position entry/exit levels. Daily charts updated every trading day at 6 PM ET. Weekly charts refresh Fridays. Monthly charts refresh on the last trading day of each month. No paywall. No sign-up required.
Built by Foliotrail.
All content on this website — including charts, analysis, price targets, support/resistance levels, and position zones — is generated entirely by AI and provided for educational and informational purposes only.
This is not financial advice. NEXUSNOIR VENTURES SL (the operator of this website) is not a registered investment adviser or broker-dealer. You should not make investment decisions based solely on this information. Always do your own research and consult a qualified financial advisor.
By continuing, you acknowledge that you have read and agree to our full disclaimer & terms of use and privacy policy.