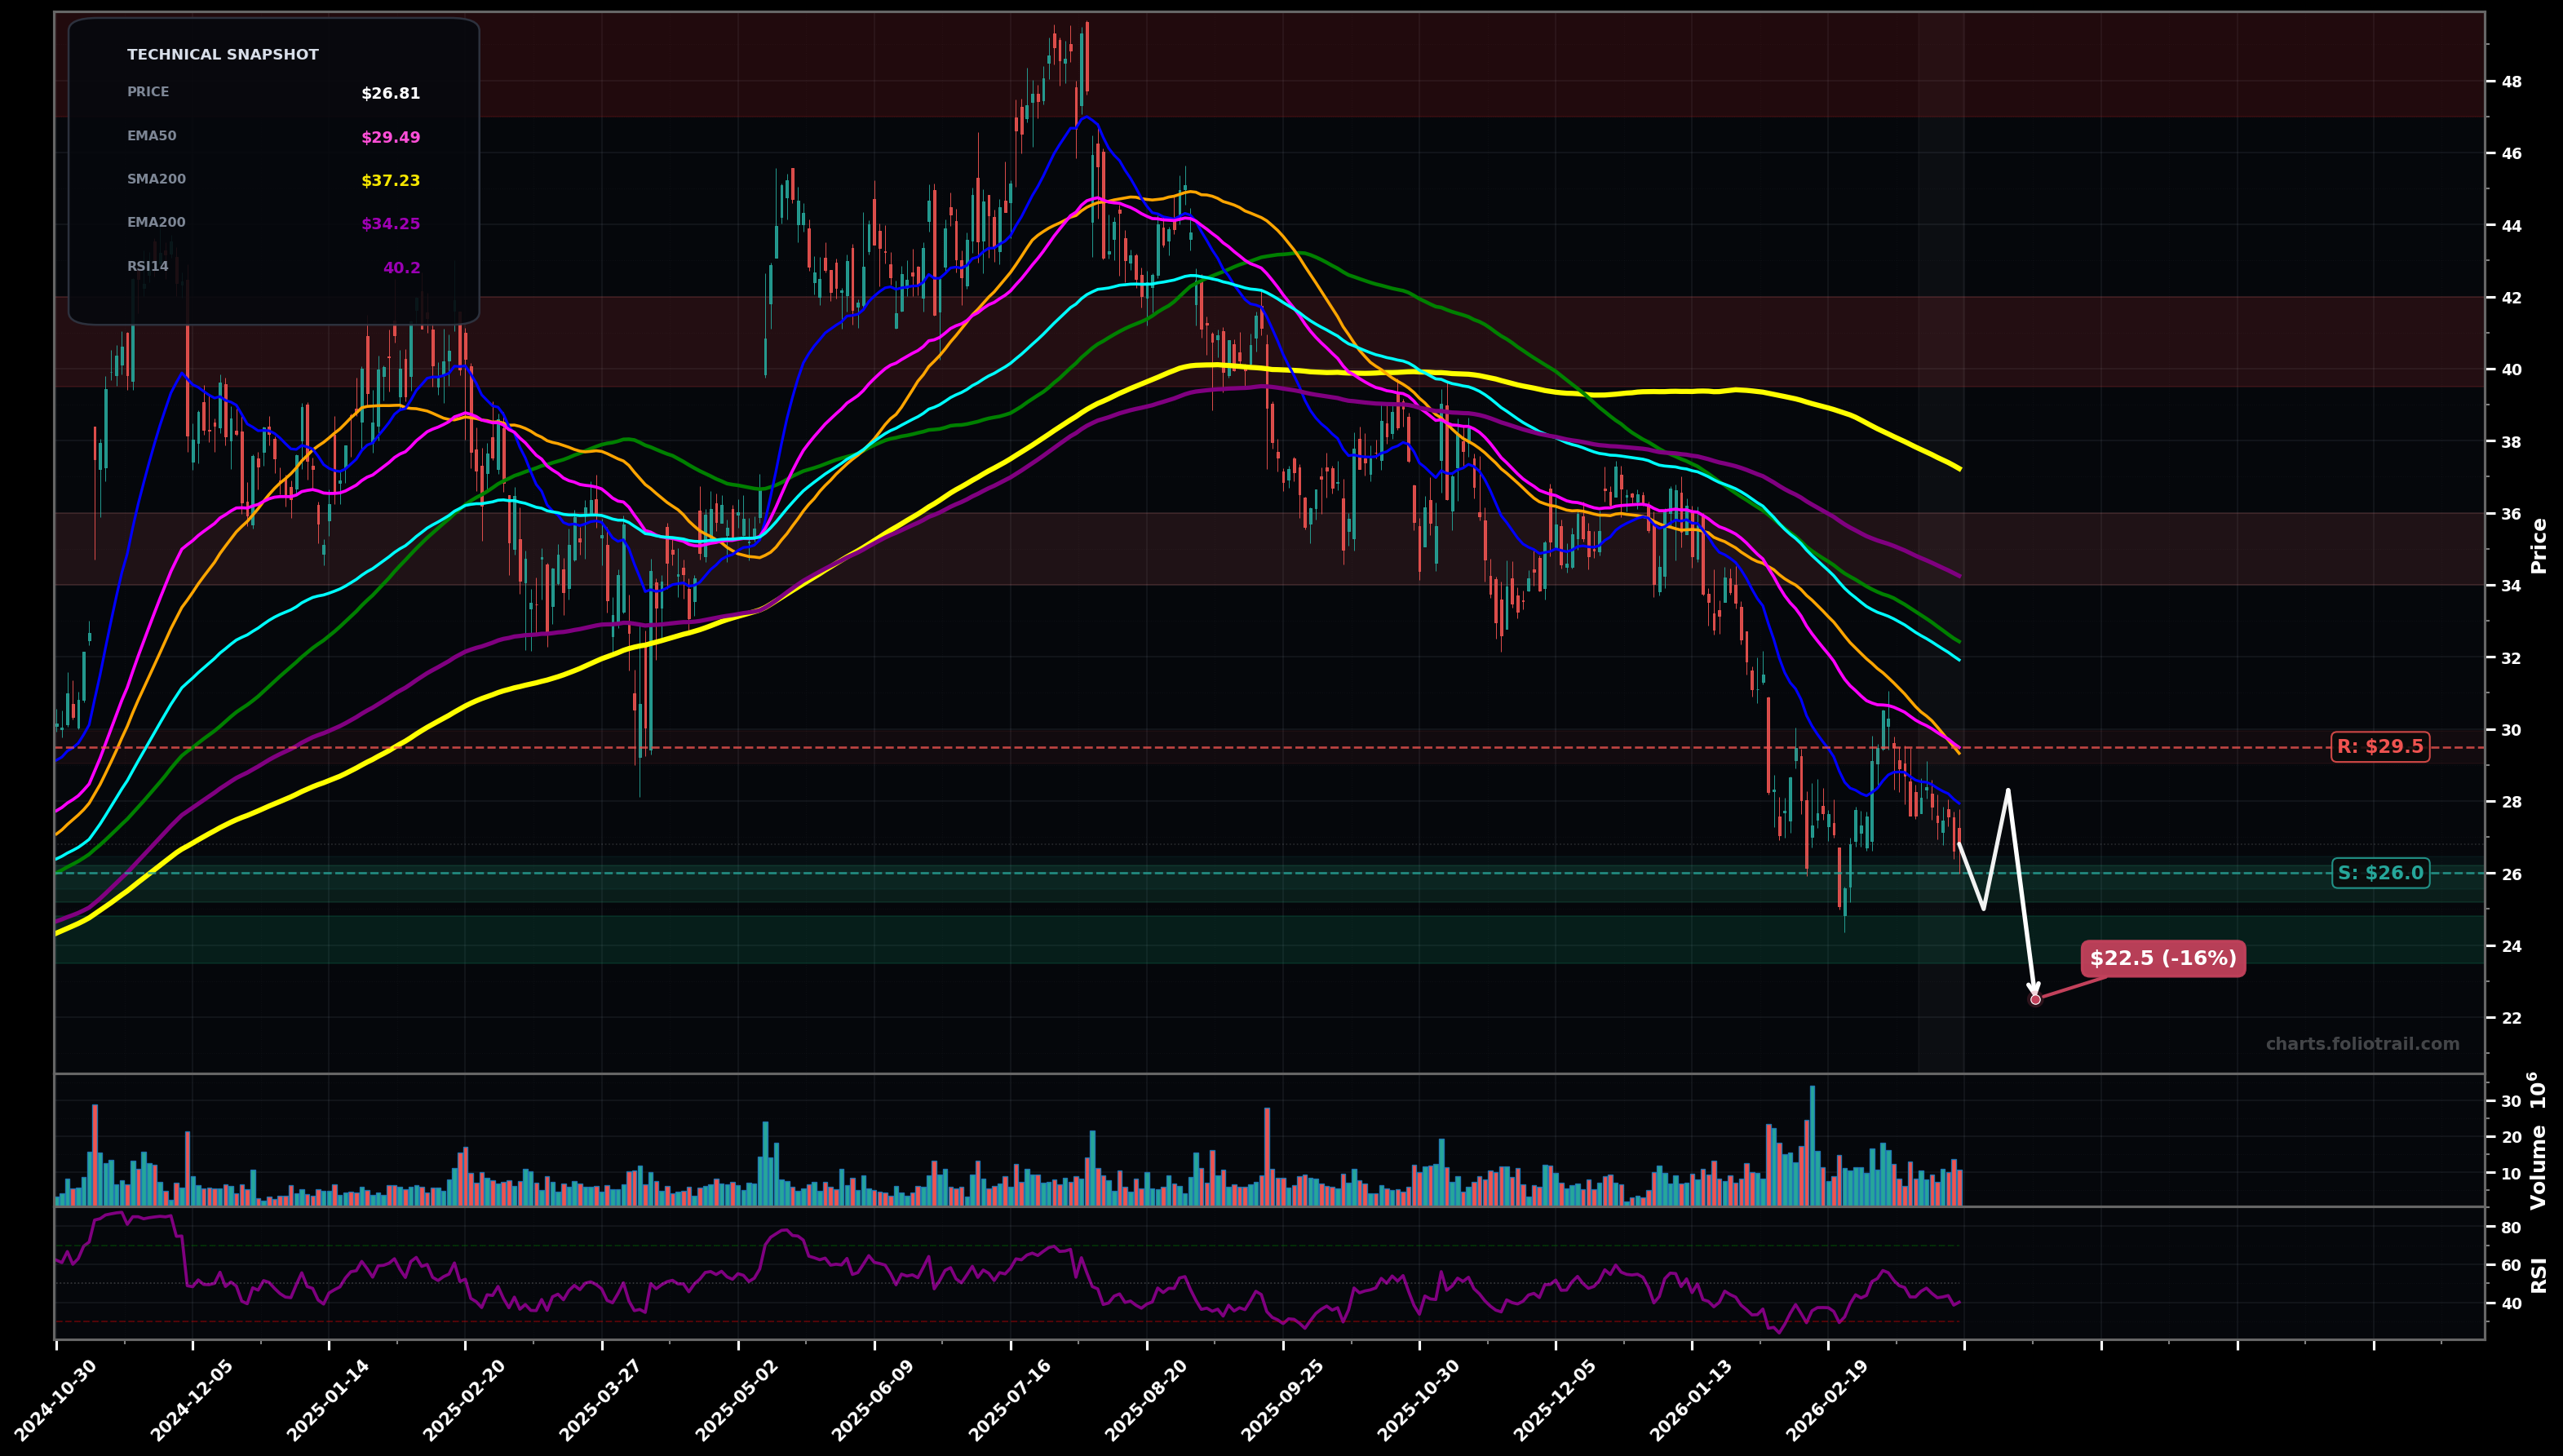
As of May 22, 2026, TOST (Toast Inc.) is in a falling knife state on the daily chart, with a confidence level of 72%. Key support is at $22.8 and key resistance at $26.6. Price at $23.16 made a fresh swing low after a sharp breakdown; trading well below all key EMAs/SMAs with RSI ~$36 (weak bounce attempt only).
Dead-cat bounce / relief rally from the new low, likely stalling at the first moving-average supply (EMA20/EMA50 zone), then another leg down unless $26.65 is reclaimed. (Elliott: likely in wave 5 down or wave C of a larger ABC from the ~$48 top; bounce would be wave (iv) before a final push.)
Bottoming attempt forms if price holds above the current low and puts in a HL, then reclaims EMA20/EMA50; would set up an ABC rebound toward the broken breakdown area near the low $30s. (Fib: rebound often targets ~38.2%–50% of the last impulse down, aligning with ~$28–$31.)
Daily close below $22.80 with no immediate reclaim the next session
2+ daily closes back above $26.65 (EMA50) while holding above $26.00
Buy zones are anchored to the fresh swing-low support ($22.8) and measured extensions below it; only add aggressively deeper if volatility spike/capitulation holds and a HL/undercut-and-rally appears.
Trim into prior supply/major MA clusters and the prior distribution zone (mid-$30s to low-$40s); full exit near the prior peak area where long-term mean reversion/sellers historically dominate.
As of May 22, 2026, TOST (Toast Inc.) is in a falling knife state on the daily chart with 72% confidence. Price at $23.16 made a fresh swing low after a sharp breakdown; trading well below all key EMAs/SMAs with RSI ~$36 (weak bounce attempt only).
On the daily timeframe, TOST has key support at $22.8 and key resistance at $26.6. The most likely scenario (bearish) targets $20.6 and $18.9, with a revert level at $25.0.
TOST (Toast Inc.) is currently classified as falling knife on the daily chart, with 72% confidence. Confirmation requires: Daily close below $22.80 with no immediate reclaim the next session This would be invalidated by: 2+ daily closes back above $26.65 (EMA50) while holding above $26.00
The most likely scenario (bearish) targets $20.6 and $18.9, with a revert level at $25.0. The alternative scenario (bullish) targets $28.8 and $31.6.
Multi-layer AI agents analyse 200+ stocks across daily, weekly, and monthly timeframes — producing market state classifications, price scenarios with targets, and position entry/exit levels. Daily charts updated every trading day at 6 PM ET. Weekly charts refresh Fridays. Monthly charts refresh on the last trading day of each month. No paywall. No sign-up required.
Built by Foliotrail.
All content on this website — including charts, analysis, price targets, support/resistance levels, and position zones — is generated entirely by AI and provided for educational and informational purposes only.
This is not financial advice. NEXUSNOIR VENTURES SL (the operator of this website) is not a registered investment adviser or broker-dealer. You should not make investment decisions based solely on this information. Always do your own research and consult a qualified financial advisor.
By continuing, you acknowledge that you have read and agree to our full disclaimer & terms of use and privacy policy.