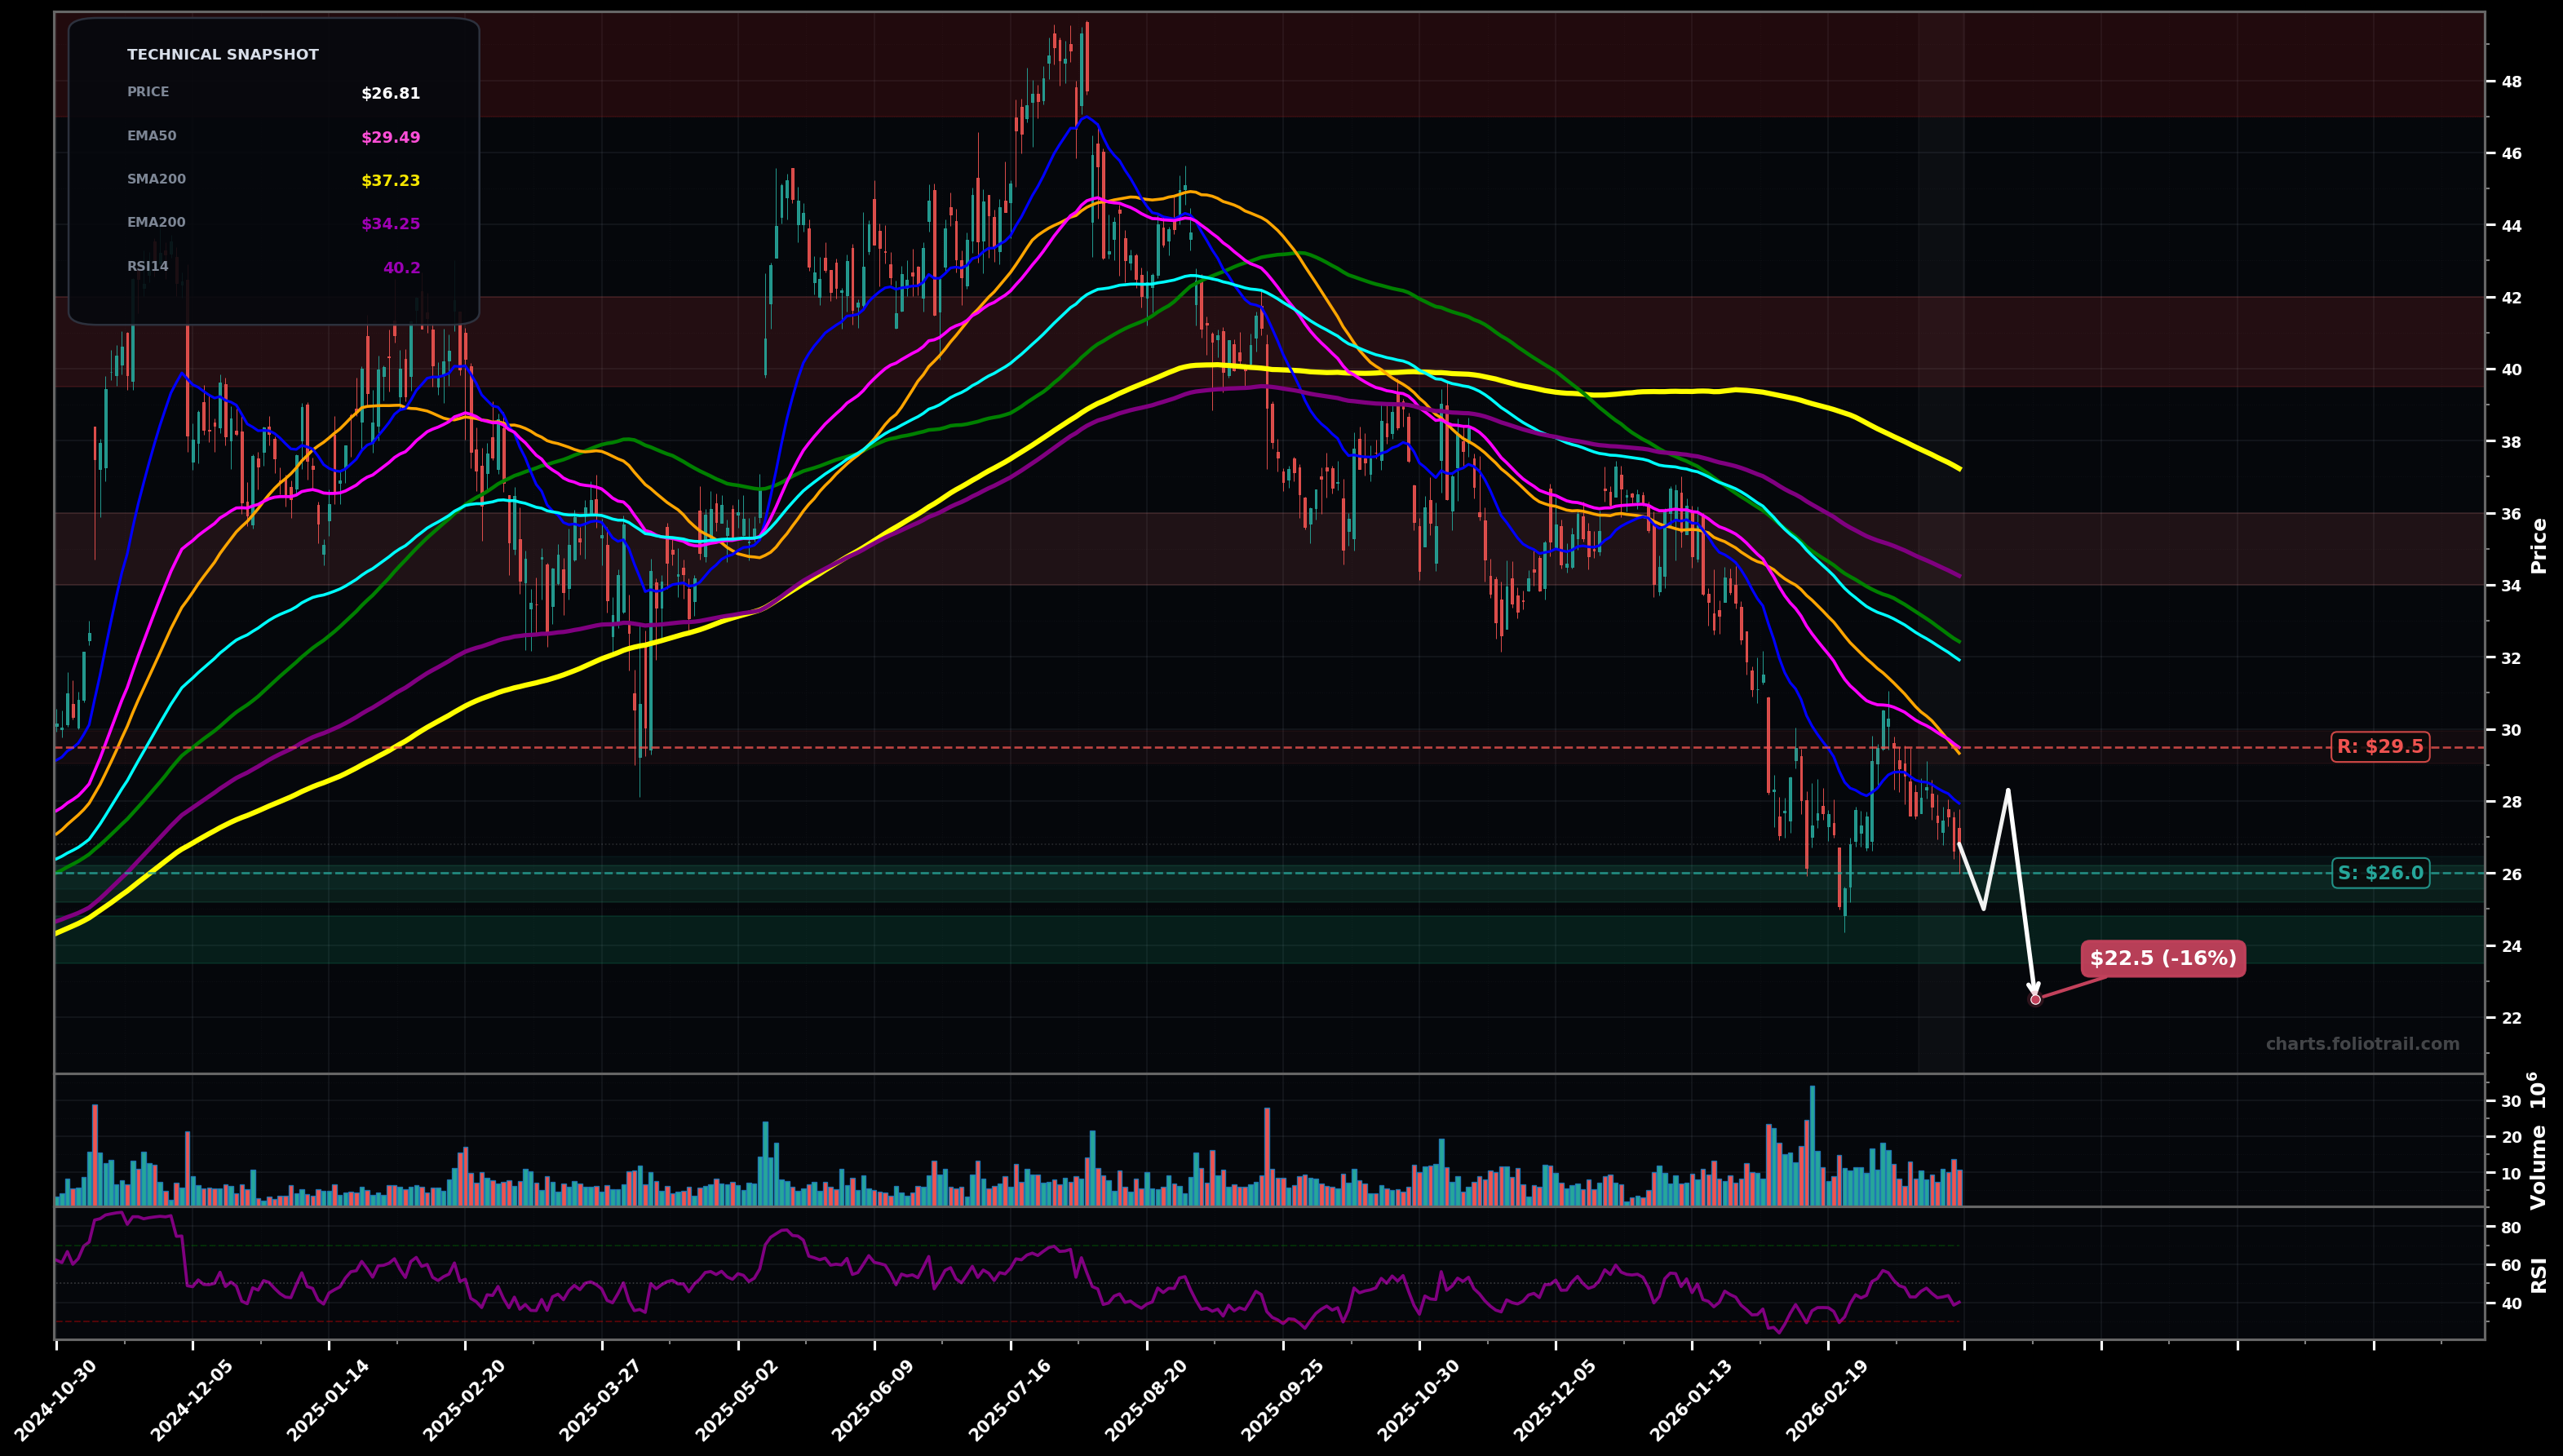
As of March 26, 2026, TOST (Toast Inc.) is in a falling knife state on the daily chart, with a confidence level of 74%. Key support is at $26.0 and key resistance at $29.5. Price at $26.81 continues to print LH/LL structure below all key EMAs/SMAs after a sharp breakdown; last bounce attempts failed near the falling EMA50/EMA100 cluster.
Bearish continuation: price chops briefly near $26 support, then breaks to a fresh swing low as sellers defend the falling EMA50/EMA100; any bounce is likely corrective (Elliott: still in wave 5 of the decline or an extended C-leg).
Bottoming attempt: a higher low forms above $26 and price reclaims the $29-$30 supply/EMA50 zone, setting up a larger mean-reversion rally (Elliott: wave 1 up off lows then wave 2 pullback, or end of wave 5 and start of ABC up).
Daily close below $26.00 followed by another lower low would confirm continued falling-knife behavior
Two+ daily closes back above $29.50 (EMA50 area) would invalidate the falling-knife state and shift toward a bottoming attempt
Scale only at/under the current swing-low support ($26) and deeper Fibonacci-style retrace zones; trend is down and rallies likely fade into EMA50/EMA100 overhead.
Trim into likely overhead supply where prior breakdowns occurred and where long MAs cluster (SMA50/100 then SMA200/EMA200 zones), with full exit near prior major distribution highs.
As of March 26, 2026, TOST (Toast Inc.) is in a falling knife state on the daily chart with 74% confidence. Price at $26.81 continues to print LH/LL structure below all key EMAs/SMAs after a sharp breakdown; last bounce attempts failed near the falling EMA50/EMA100 cluster.
On the daily timeframe, TOST has key support at $26.0 and key resistance at $29.5. The most likely scenario (bearish) targets $25.0 and $22.5, with a revert level at $28.3.
TOST (Toast Inc.) is currently classified as falling knife on the daily chart, with 74% confidence. Confirmation requires: Daily close below $26.00 followed by another lower low would confirm continued falling-knife behavior This would be invalidated by: Two+ daily closes back above $29.50 (EMA50 area) would invalidate the falling-knife state and shift toward a bottoming attempt
The most likely scenario (bearish) targets $25.0 and $22.5, with a revert level at $28.3. The alternative scenario (bullish) targets $31.9 and $34.2.
Multi-layer AI agents analyse 200+ stocks across daily, weekly, and monthly timeframes — producing market state classifications, price scenarios with targets, and position entry/exit levels. Updated every trading day after market close. No paywall. No sign-up required.
Built by Foliotrail.
All content on this website — including charts, analysis, price targets, support/resistance levels, and position zones — is generated entirely by AI and provided for educational and informational purposes only.
This is not financial advice. NEXUSNOIR VENTURES SL (the operator of this website) is not a registered investment adviser or broker-dealer. You should not make investment decisions based solely on this information. Always do your own research and consult a qualified financial advisor.
By continuing, you acknowledge that you have read and agree to our full disclaimer & terms of use and privacy policy.