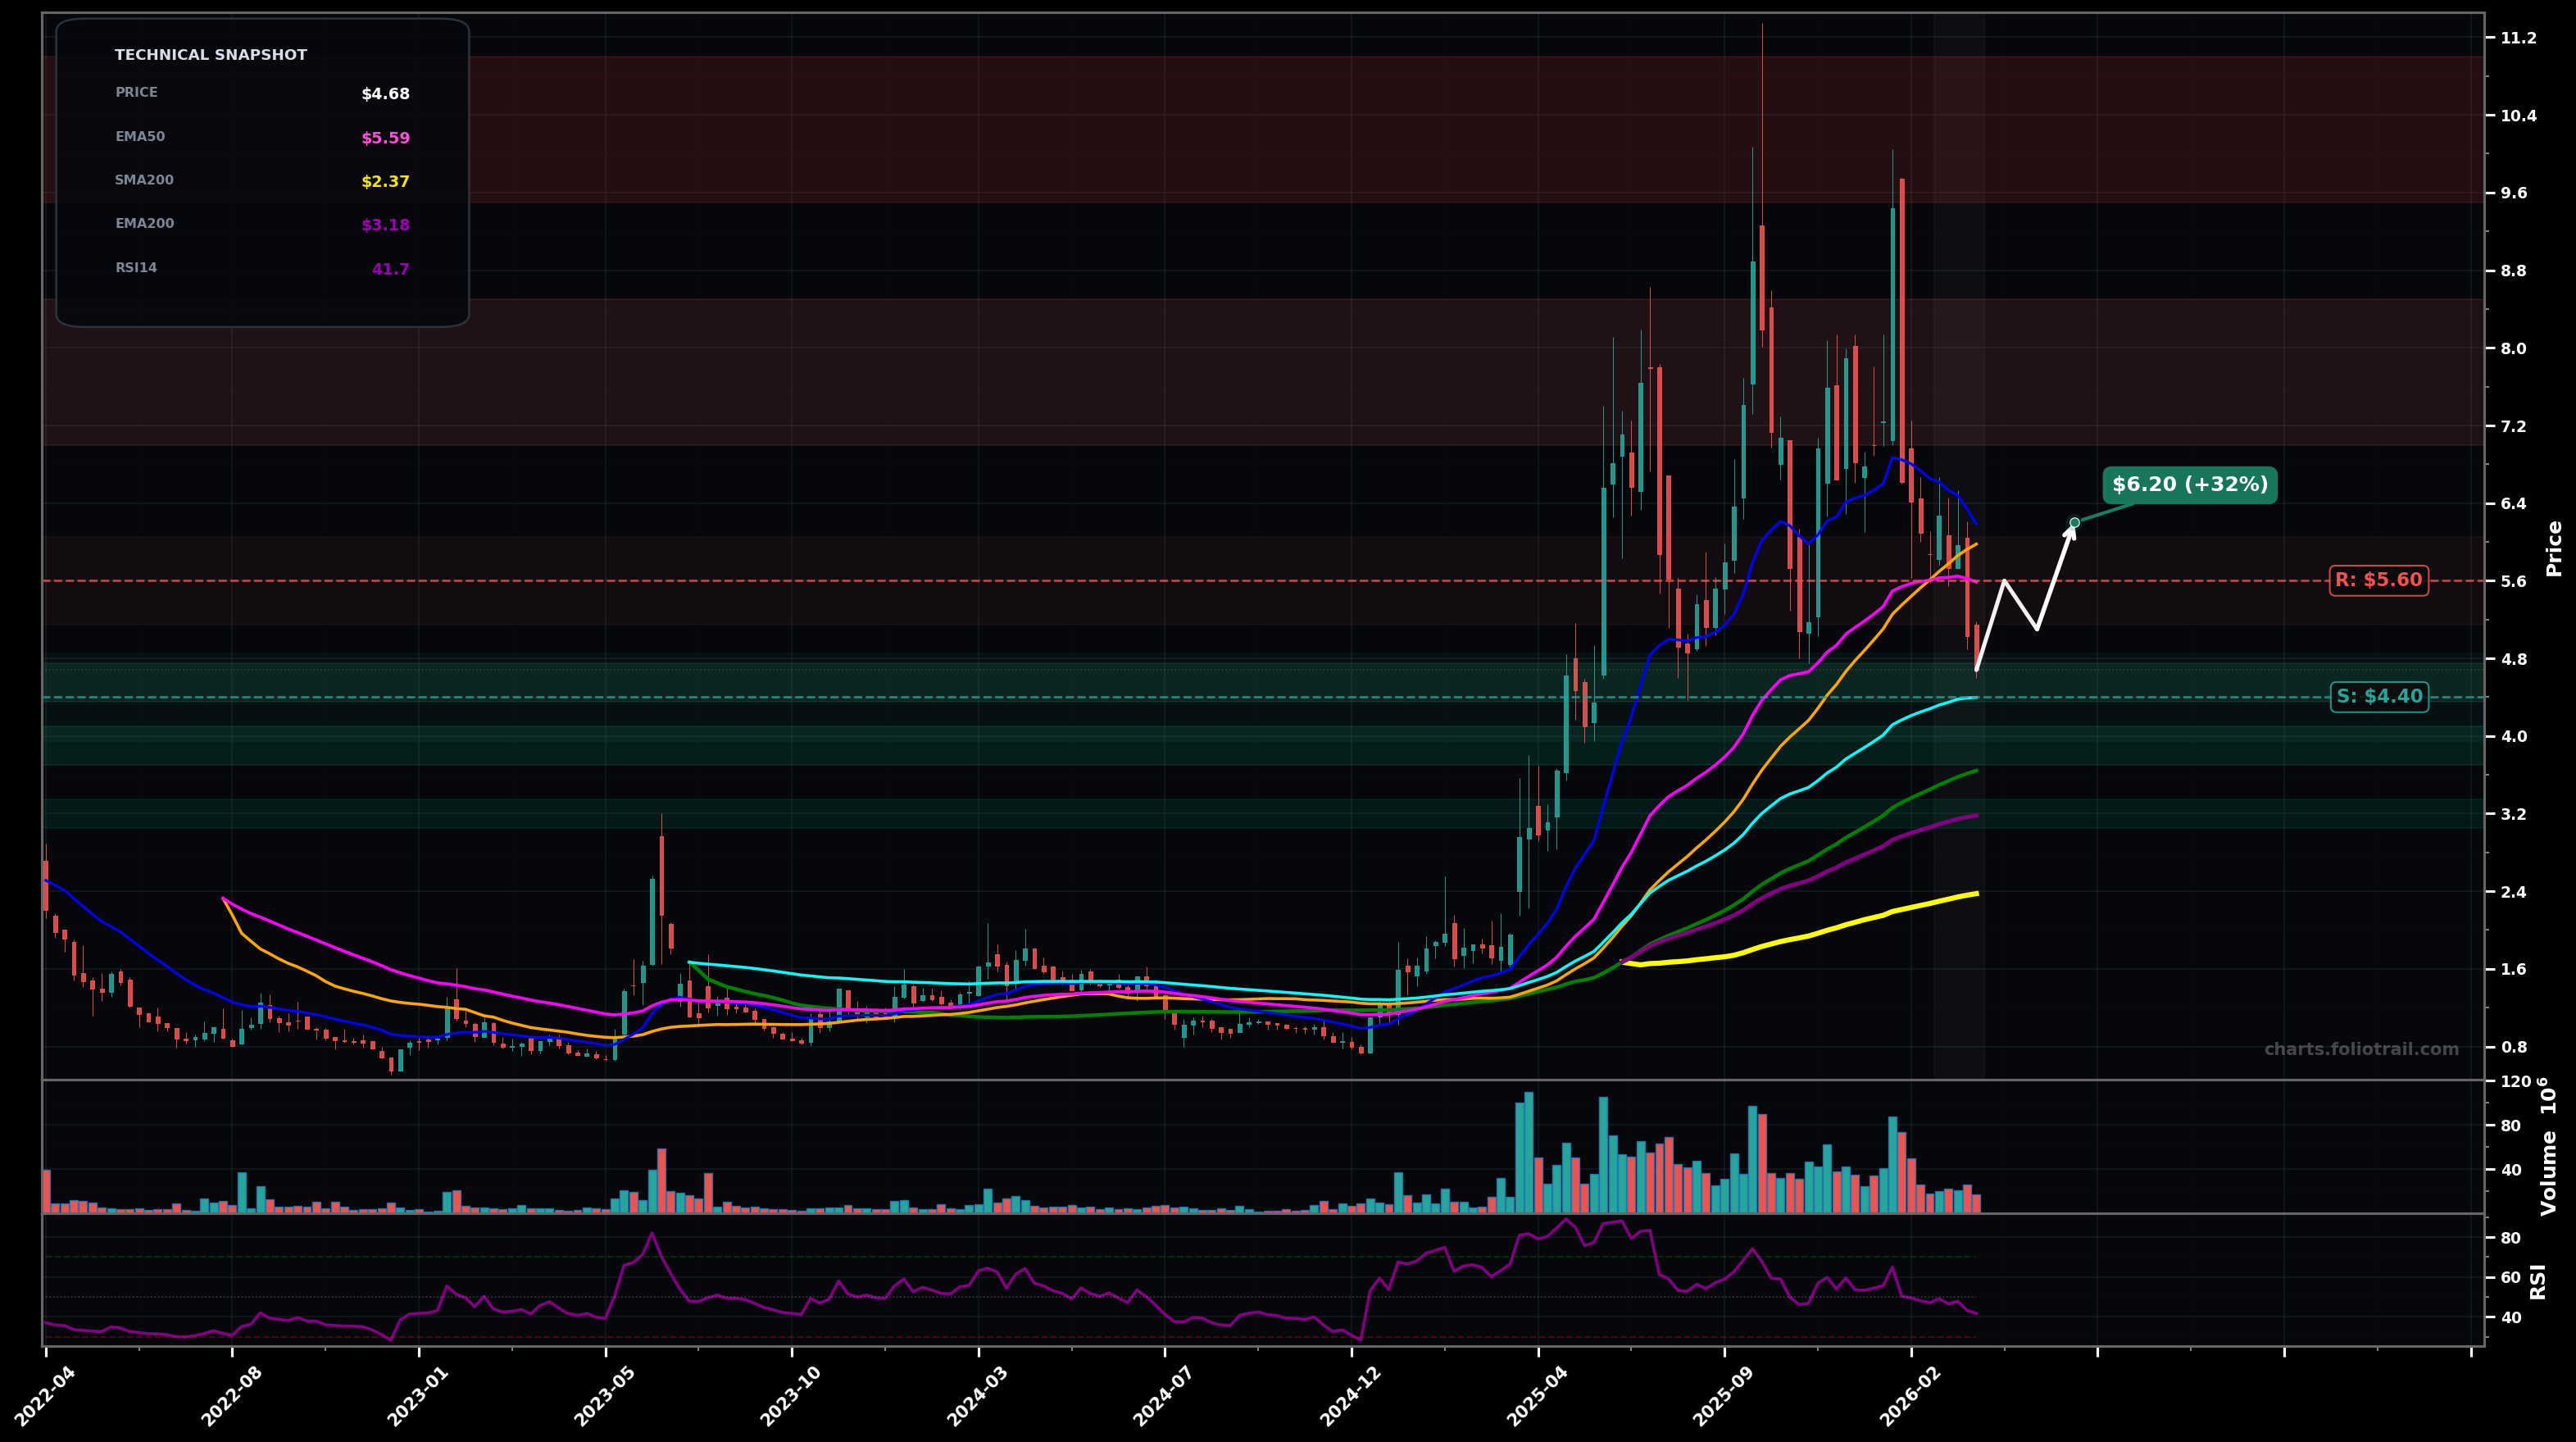
As of March 25, 2026, TMC (TMC the metals company Inc.) is in a bottoming attempt state on the weekly chart, with a confidence level of 58%. Key support is at $4.40 and key resistance at $5.60. Weekly pullback from the $6-$7 zone; price now ~$4.68 and under EMA50 ($5.59) and EMA100 ($4.40) after a momentum peak near ~$11; RSI14 ~41 shows cooling but not washed-out.
Base-building between ~$4.40-$5.60 followed by a rebound to retest the breakdown area; Elliott view: corrective Wave (4) chopping before a push toward a Wave (5) attempt; Fib: likely retrace into the 0.382-0.5 zone of the last downswing.
Support fails at EMA100 and price mean-reverts toward the rising long-term cluster (EMA200/SMA100) for a deeper Wave (C)/Wave (2) style correction; watch for high-volume red weeks as confirmation.
2+ weekly closes back above $5.60 (EMA50) would confirm a breakout-reversal attempt from this pullback.
Weekly close below $4.40 (EMA100) shifts bias back toward a deeper corrective leg.
Start near EMA100/pivot demand (~$4.40); add on a breakdown/retest toward prior base/volume shelf (~$3.8-$4.1); heavy add near rising EMA200 (~$3.18) where higher-timeframe trend support should be strongest.
Trim into prior supply from the parabolic top region ($7-$11); fully close only on a new extension well above the prior high (price likely stretched far above EMA50/100, high reversal risk).
As of March 25, 2026, TMC (TMC the metals company Inc.) is in a bottoming attempt state on the weekly chart with 58% confidence. Weekly pullback from the $6-$7 zone; price now ~$4.68 and under EMA50 ($5.59) and EMA100 ($4.40) after a momentum peak near ~$11; RSI14 ~41 shows cooling but not washed-out.
On the weekly timeframe, TMC has key support at $4.40 and key resistance at $5.60. The most likely scenario (bullish) targets $5.60 and $6.20, with a revert level at $5.10.
TMC (TMC the metals company Inc.) is currently classified as bottoming attempt on the weekly chart, with 58% confidence. Confirmation requires: 2+ weekly closes back above $5.60 (EMA50) would confirm a breakout-reversal attempt from this pullback. This would be invalidated by: Weekly close below $4.40 (EMA100) shifts bias back toward a deeper corrective leg.
The most likely scenario (bullish) targets $5.60 and $6.20, with a revert level at $5.10. The alternative scenario (bearish) targets $3.80 and $3.20.
Multi-layer AI agents analyse 200+ stocks across daily, weekly, and monthly timeframes — producing market state classifications, price scenarios with targets, and position entry/exit levels. Updated every trading day after market close. No paywall. No sign-up required.
Built by Foliotrail.
All content on this website — including charts, analysis, price targets, support/resistance levels, and position zones — is generated entirely by AI and provided for educational and informational purposes only.
This is not financial advice. NEXUSNOIR VENTURES SL (the operator of this website) is not a registered investment adviser or broker-dealer. You should not make investment decisions based solely on this information. Always do your own research and consult a qualified financial advisor.
By continuing, you acknowledge that you have read and agree to our full disclaimer & terms of use and privacy policy.