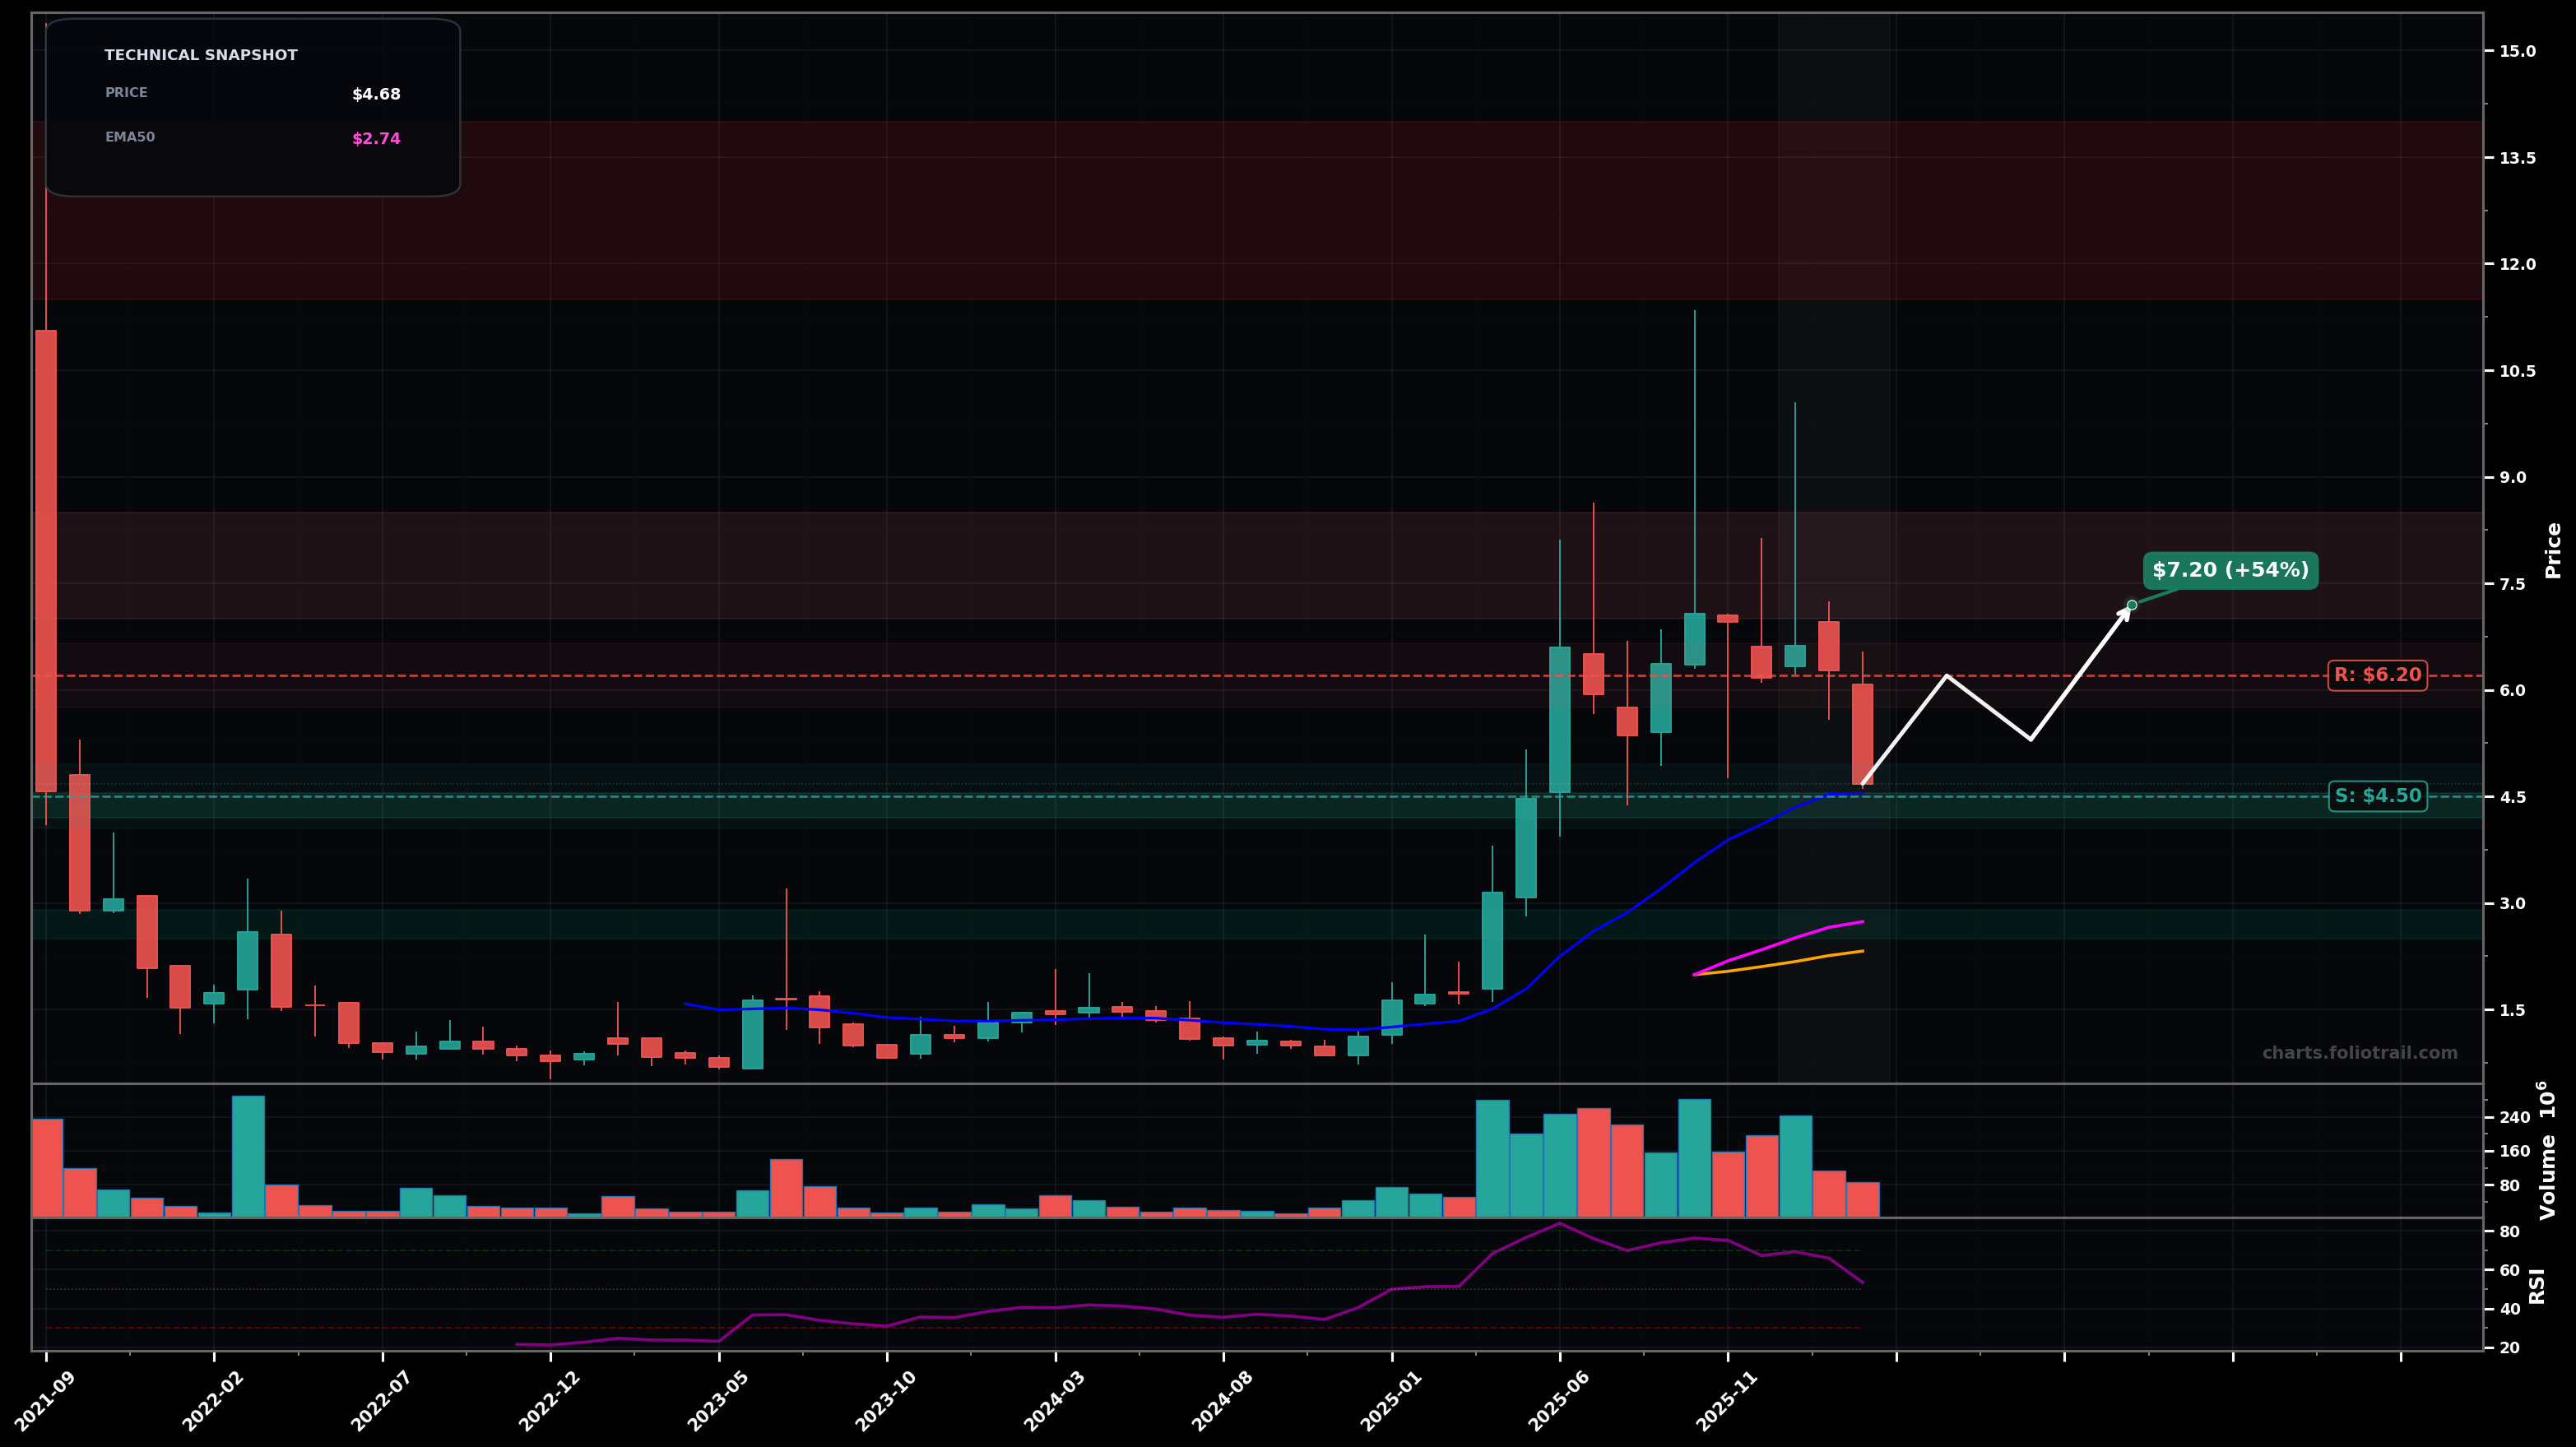
As of March 25, 2026, TMC (TMC the metals company Inc.) is in a volatility expansion state on the monthly chart, with a confidence level of 67%. Key support is at $4.50 and key resistance at $6.20. After a sharp run-up into ~$6–$7, price is pulling back to ~$4.68 and testing the rising short-term trend/EMA area while RSI cools to ~53.
Controlled pullback holds the ~$4.50–$4.20 area (EMA20/swing support), then rotates back up toward the prior distribution zone; this acts like an Elliott Wave (4) consolidation after an impulsive run, with potential push into a smaller Wave (5) retest.
Breakdown through ~$4.50 and loss of the ~$4.20 pivot triggers a deeper retrace toward the breakout base; this fits a larger ABC correction where C extends toward prior accumulation/MA cluster.
Monthly close below ~$4.50 followed by another close below ~$4.20 would confirm downside continuation within the expansion phase
Monthly close back above ~$6.20 would invalidate near-term bearish continuation risk and shift bias back toward trend resumption
Start near EMA20/first HL attempt support (~$4.5); add on a 0.5–0.618-style retrace into prior breakout zone (~$3.3–$3.7); heavy add near deeper retrace + MA cluster/old base (~$2.5–$2.9).
Trim into prior wick-supply and extension above the recent peak (~$7+), increase trimming into major prior spike/wick zone (~$9–$11), and fully close if price revisits extreme blow-off territory (~$11.5–$14) where probability of multi-year mean reversion rises.
As of March 25, 2026, TMC (TMC the metals company Inc.) is in a volatility expansion state on the monthly chart with 67% confidence. After a sharp run-up into ~$6–$7, price is pulling back to ~$4.68 and testing the rising short-term trend/EMA area while RSI cools to ~53.
On the monthly timeframe, TMC has key support at $4.50 and key resistance at $6.20. The most likely scenario (bullish) targets $6.20 and $7.20, with a revert level at $5.30.
TMC (TMC the metals company Inc.) is currently classified as volatility expansion on the monthly chart, with 67% confidence. Confirmation requires: Monthly close below ~$4.50 followed by another close below ~$4.20 would confirm downside continuation within the expansion phase This would be invalidated by: Monthly close back above ~$6.20 would invalidate near-term bearish continuation risk and shift bias back toward trend resumption
The most likely scenario (bullish) targets $6.20 and $7.20, with a revert level at $5.30. The alternative scenario (bearish) targets $3.40 and $2.70.
Multi-layer AI agents analyse 200+ stocks across daily, weekly, and monthly timeframes — producing market state classifications, price scenarios with targets, and position entry/exit levels. Updated every trading day after market close. No paywall. No sign-up required.
Built by Foliotrail.
All content on this website — including charts, analysis, price targets, support/resistance levels, and position zones — is generated entirely by AI and provided for educational and informational purposes only.
This is not financial advice. NEXUSNOIR VENTURES SL (the operator of this website) is not a registered investment adviser or broker-dealer. You should not make investment decisions based solely on this information. Always do your own research and consult a qualified financial advisor.
By continuing, you acknowledge that you have read and agree to our full disclaimer & terms of use and privacy policy.