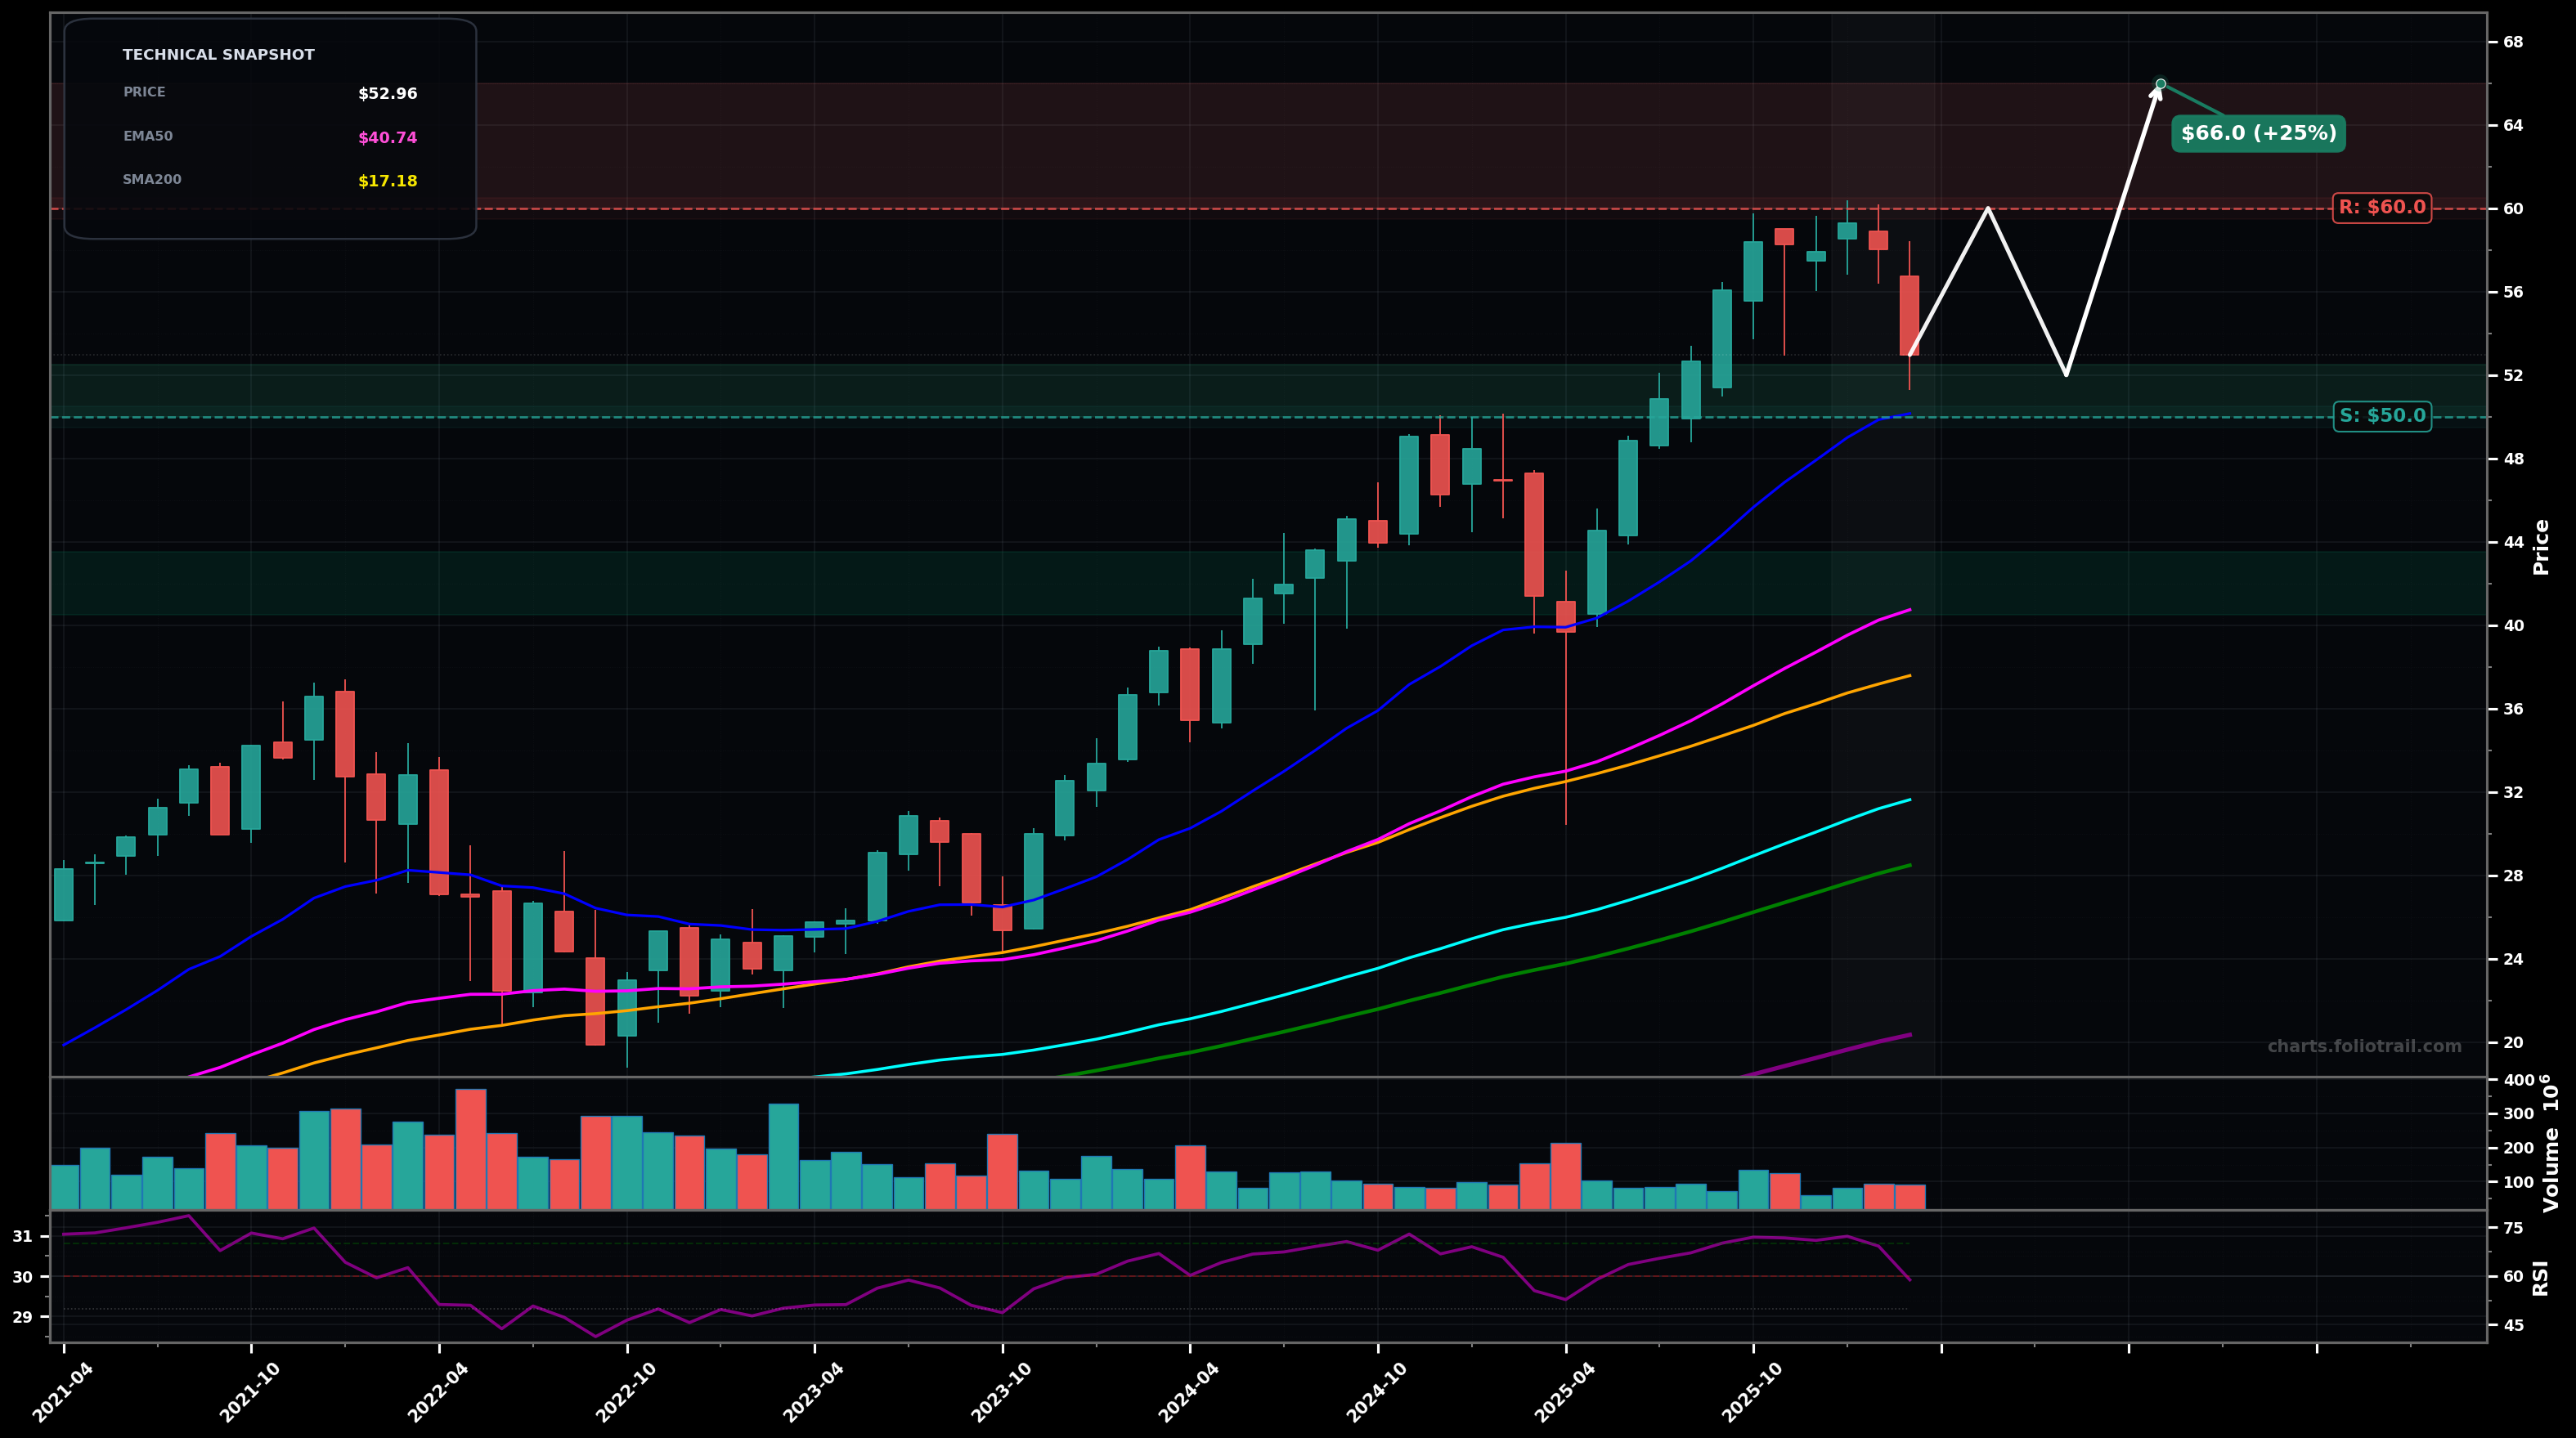
As of March 24, 2026, SSO (ProShares Ultra S&P500) is in a uptrend state on the monthly chart, with a confidence level of 72%. Key support is at $50.0 and key resistance at $60.0. Monthly uptrend pulled back from the ~$59-$60 swing high to ~$53, but price still holds well above rising EMA50/EMA100 and prior breakout structure.
Bullish continuation after a shallow consolidation: price holds $50-$52, then grinds back up to retest the $59-$60 highs; if that breaks, extension toward the next Fibonacci projection zone.
Deeper ABC-style correction (Elliott Wave) from the ~$60 top: failure to reclaim $57-$58 leads to a larger pullback toward the EMA20/EMA50 confluence before buyers re-engage.
Monthly close back above $57.50 (reclaiming the recent breakdown candle area) would confirm trend continuation
Monthly close below $50.00 would invalidate the immediate bullish continuation setup (breaks the most recent swing-low zone and momentum structure)
Start near the prior swing/round-number support ($50-$52); add on a deeper Fibonacci retrace into prior breakout zone (~$47-$49); heavy add at EMA50 area (~$41-$43) where trend support is strongest on monthly.
Trim into prior ATH resistance ($60+) and typical fib extensions (1.272/1.618 zones roughly $66-$74); fully close into a larger extension blow-off region ($74-$85) where monthly mean-reversion risk rises sharply.
As of March 24, 2026, SSO (ProShares Ultra S&P500) is in a uptrend state on the monthly chart with 72% confidence. Monthly uptrend pulled back from the ~$59-$60 swing high to ~$53, but price still holds well above rising EMA50/EMA100 and prior breakout structure.
On the monthly timeframe, SSO has key support at $50.0 and key resistance at $60.0. The most likely scenario (bullish) targets $60.0 and $66.0, with a revert level at $52.0.
SSO (ProShares Ultra S&P500) is currently classified as uptrend on the monthly chart, with 72% confidence. Confirmation requires: Monthly close back above $57.50 (reclaiming the recent breakdown candle area) would confirm trend continuation This would be invalidated by: Monthly close below $50.00 would invalidate the immediate bullish continuation setup (breaks the most recent swing-low zone and momentum structure)
The most likely scenario (bullish) targets $60.0 and $66.0, with a revert level at $52.0. The alternative scenario (bearish) targets $47.0 and $41.0.
All content on this website — including charts, analysis, price targets, support/resistance levels, and position zones — is generated entirely by AI and provided for educational and informational purposes only.
This is not financial advice. NEXUSNOIR VENTURES SL (the operator of this website) is not a registered investment adviser or broker-dealer. You should not make investment decisions based solely on this information. Always do your own research and consult a qualified financial advisor.
By continuing, you acknowledge that you have read and agree to our full disclaimer & terms of use and privacy policy.