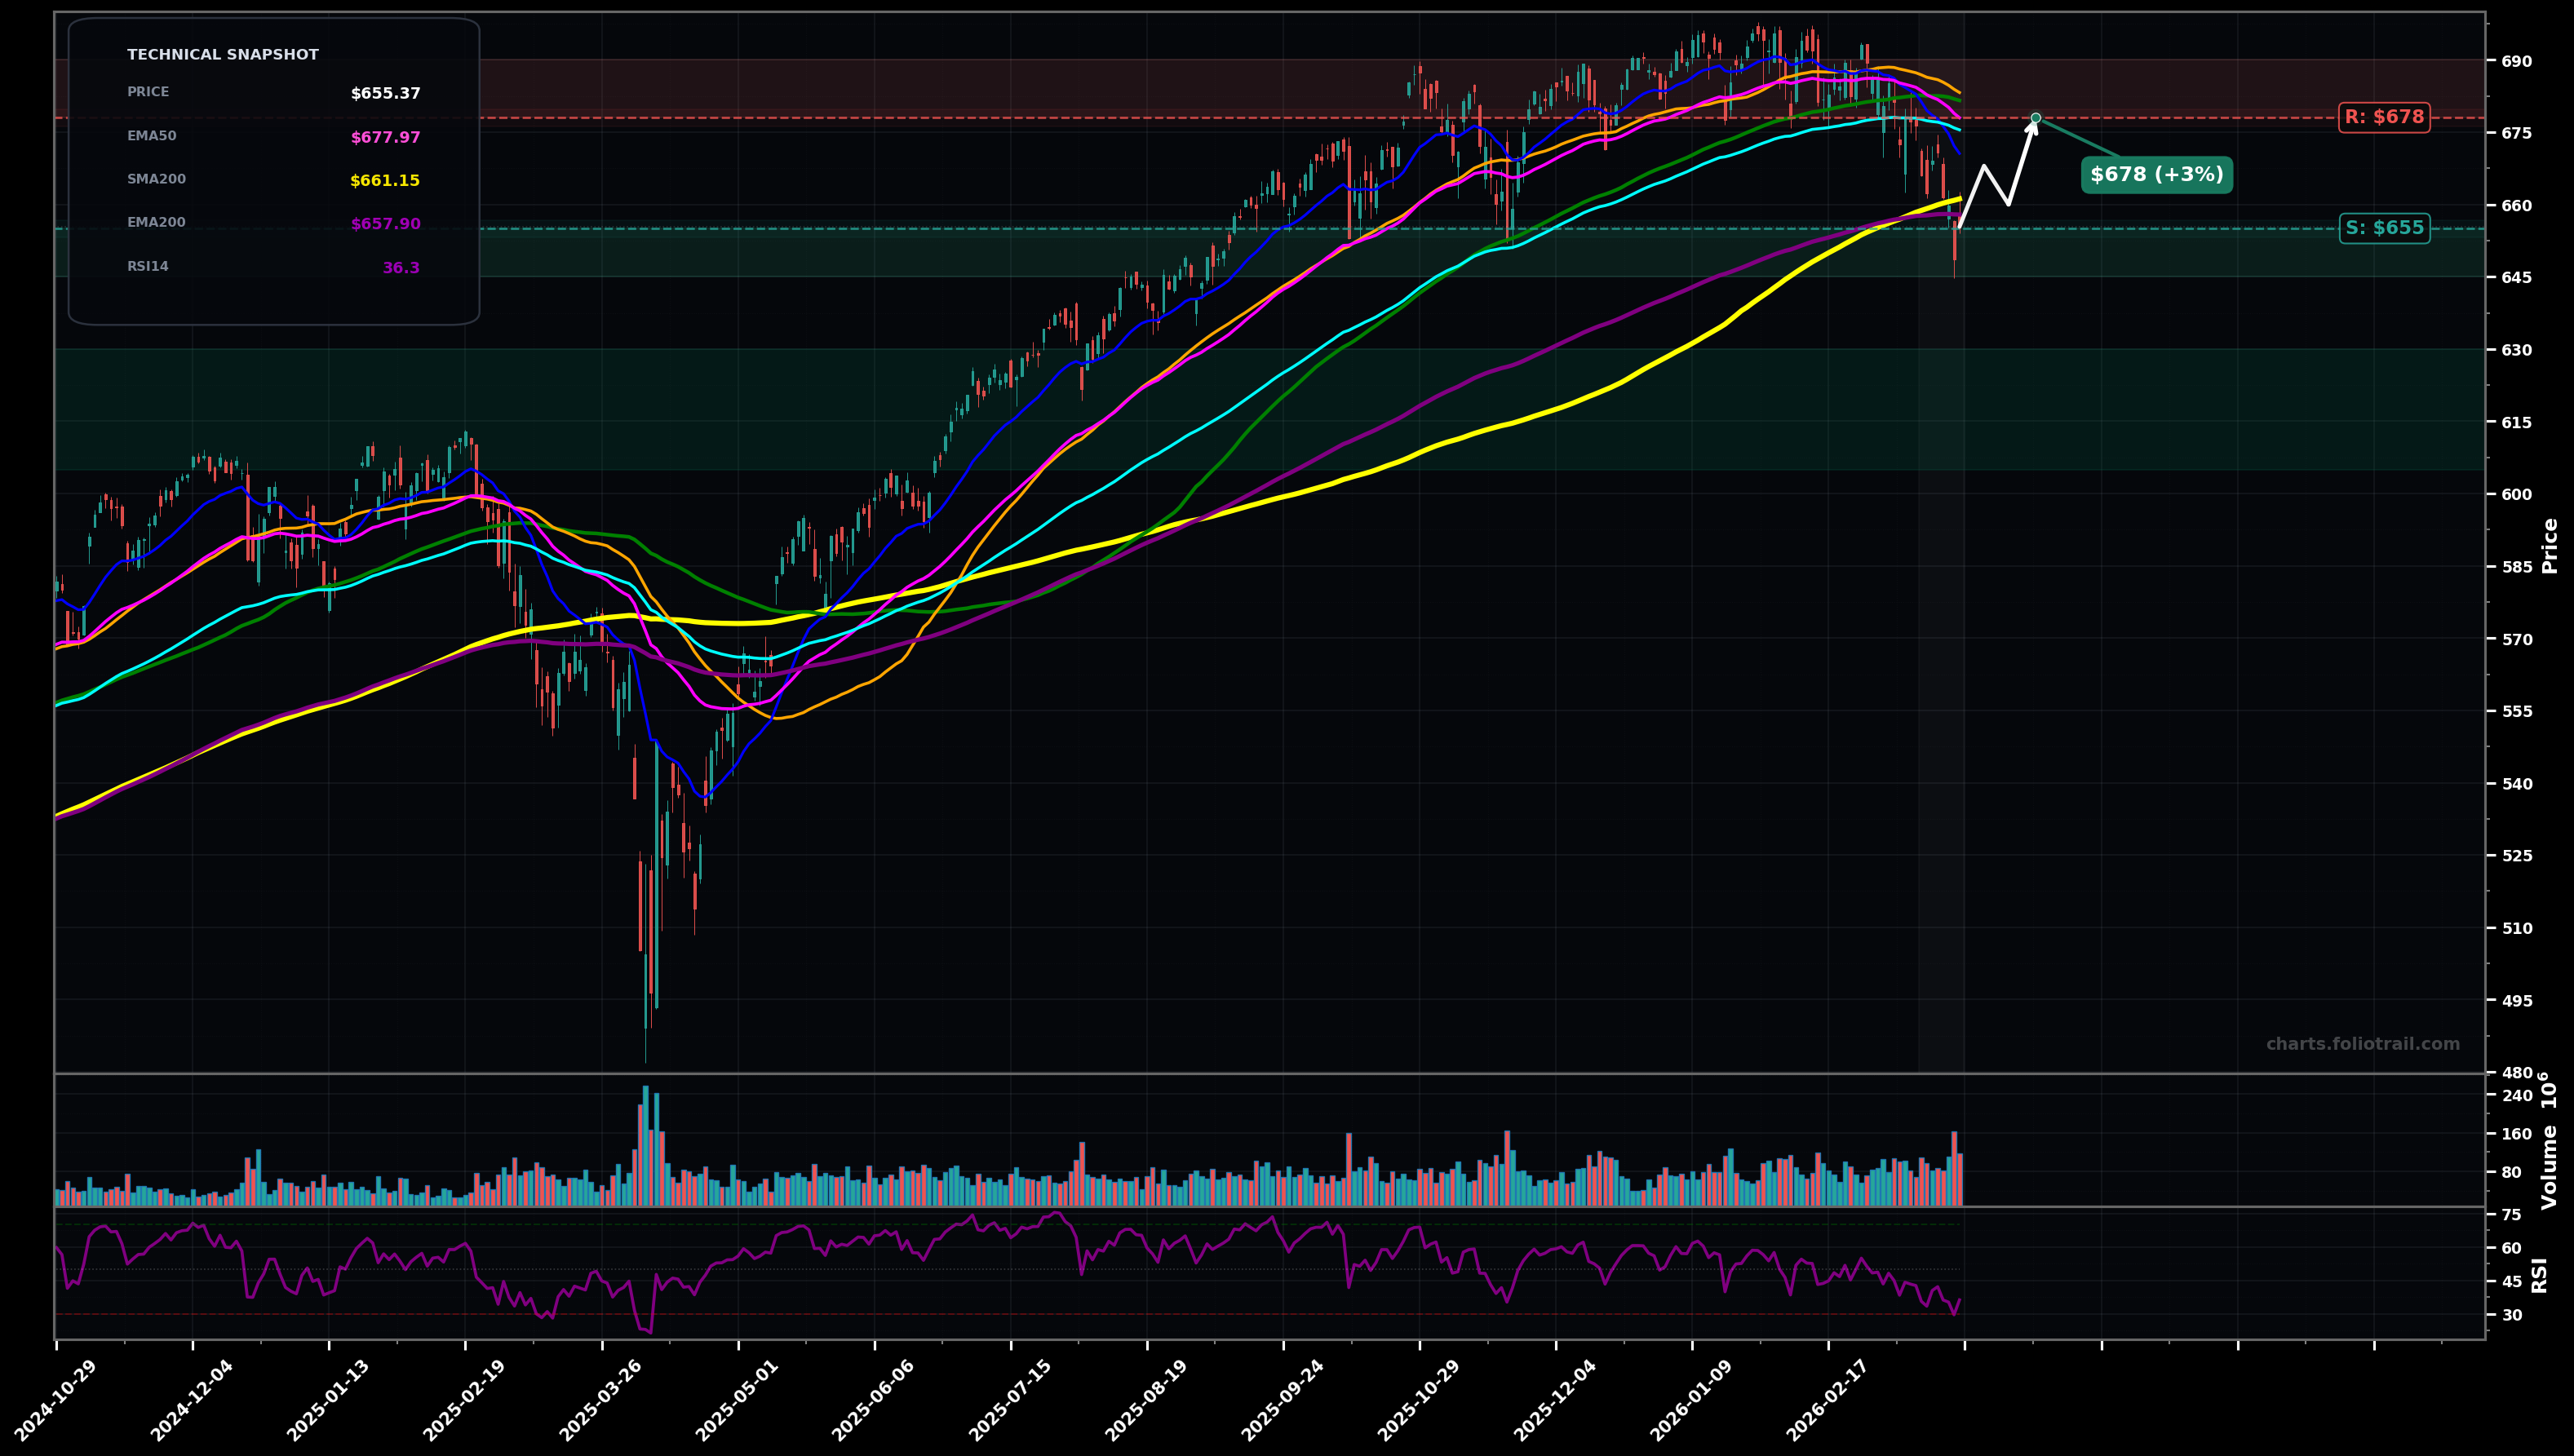
As of March 23, 2026, SPY (SPDR S&P 500 ETF Trust) is in a downtrend state on the daily chart, with a confidence level of 66%. Key support is at $655 and key resistance at $678. Sharp pullback from the $690s with price now below EMA50/EMA100 and sitting near the rising SMA200/EMA200 cluster; momentum weak (RSI ~$36).
Base attempt at the $655 MA-cluster support, then a reflex bounce toward the broken fast MAs (dead-cat/relief rally) before deciding direction.
Support fails: decisive breakdown under the $655 cluster triggers continuation selling toward the next demand zone from prior consolidation and fib retrace area.
Daily close below $655 (SMA200/EMA200 area) with follow-through next day
Daily close back above $678 (reclaim EMA50/EMA50 zone) and hold for 2+ closes
Scale near MA-cluster support first ($655), add on breakdown/next shelf ($645-$630), heavy add only if a deeper fib/structure flush occurs ($630-$605).
Trim into rebounds back to the broken top and fast-MA resistance ($678-$690); heavier trims if price re-extends to/above prior highs ($690+), full exit only on major multi-year stretch beyond prior peak zone.
As of March 23, 2026, SPY (SPDR S&P 500 ETF Trust) is in a downtrend state on the daily chart with 66% confidence. Sharp pullback from the $690s with price now below EMA50/EMA100 and sitting near the rising SMA200/EMA200 cluster; momentum weak (RSI ~$36).
On the daily timeframe, SPY has key support at $655 and key resistance at $678. The most likely scenario (bullish) targets $668 and $678, with a revert level at $660.
SPY (SPDR S&P 500 ETF Trust) is currently classified as downtrend on the daily chart, with 66% confidence. Confirmation requires: Daily close below $655 (SMA200/EMA200 area) with follow-through next day This would be invalidated by: Daily close back above $678 (reclaim EMA50/EMA50 zone) and hold for 2+ closes
The most likely scenario (bullish) targets $668 and $678, with a revert level at $660. The alternative scenario (bearish) targets $645 and $630.
All content on this website — including charts, analysis, price targets, support/resistance levels, and position zones — is generated entirely by AI and provided for educational and informational purposes only.
This is not financial advice. NEXUSNOIR VENTURES SL (the operator of this website) is not a registered investment adviser or broker-dealer. You should not make investment decisions based solely on this information. Always do your own research and consult a qualified financial advisor.
By continuing, you acknowledge that you have read and agree to our full disclaimer & terms of use and privacy policy.