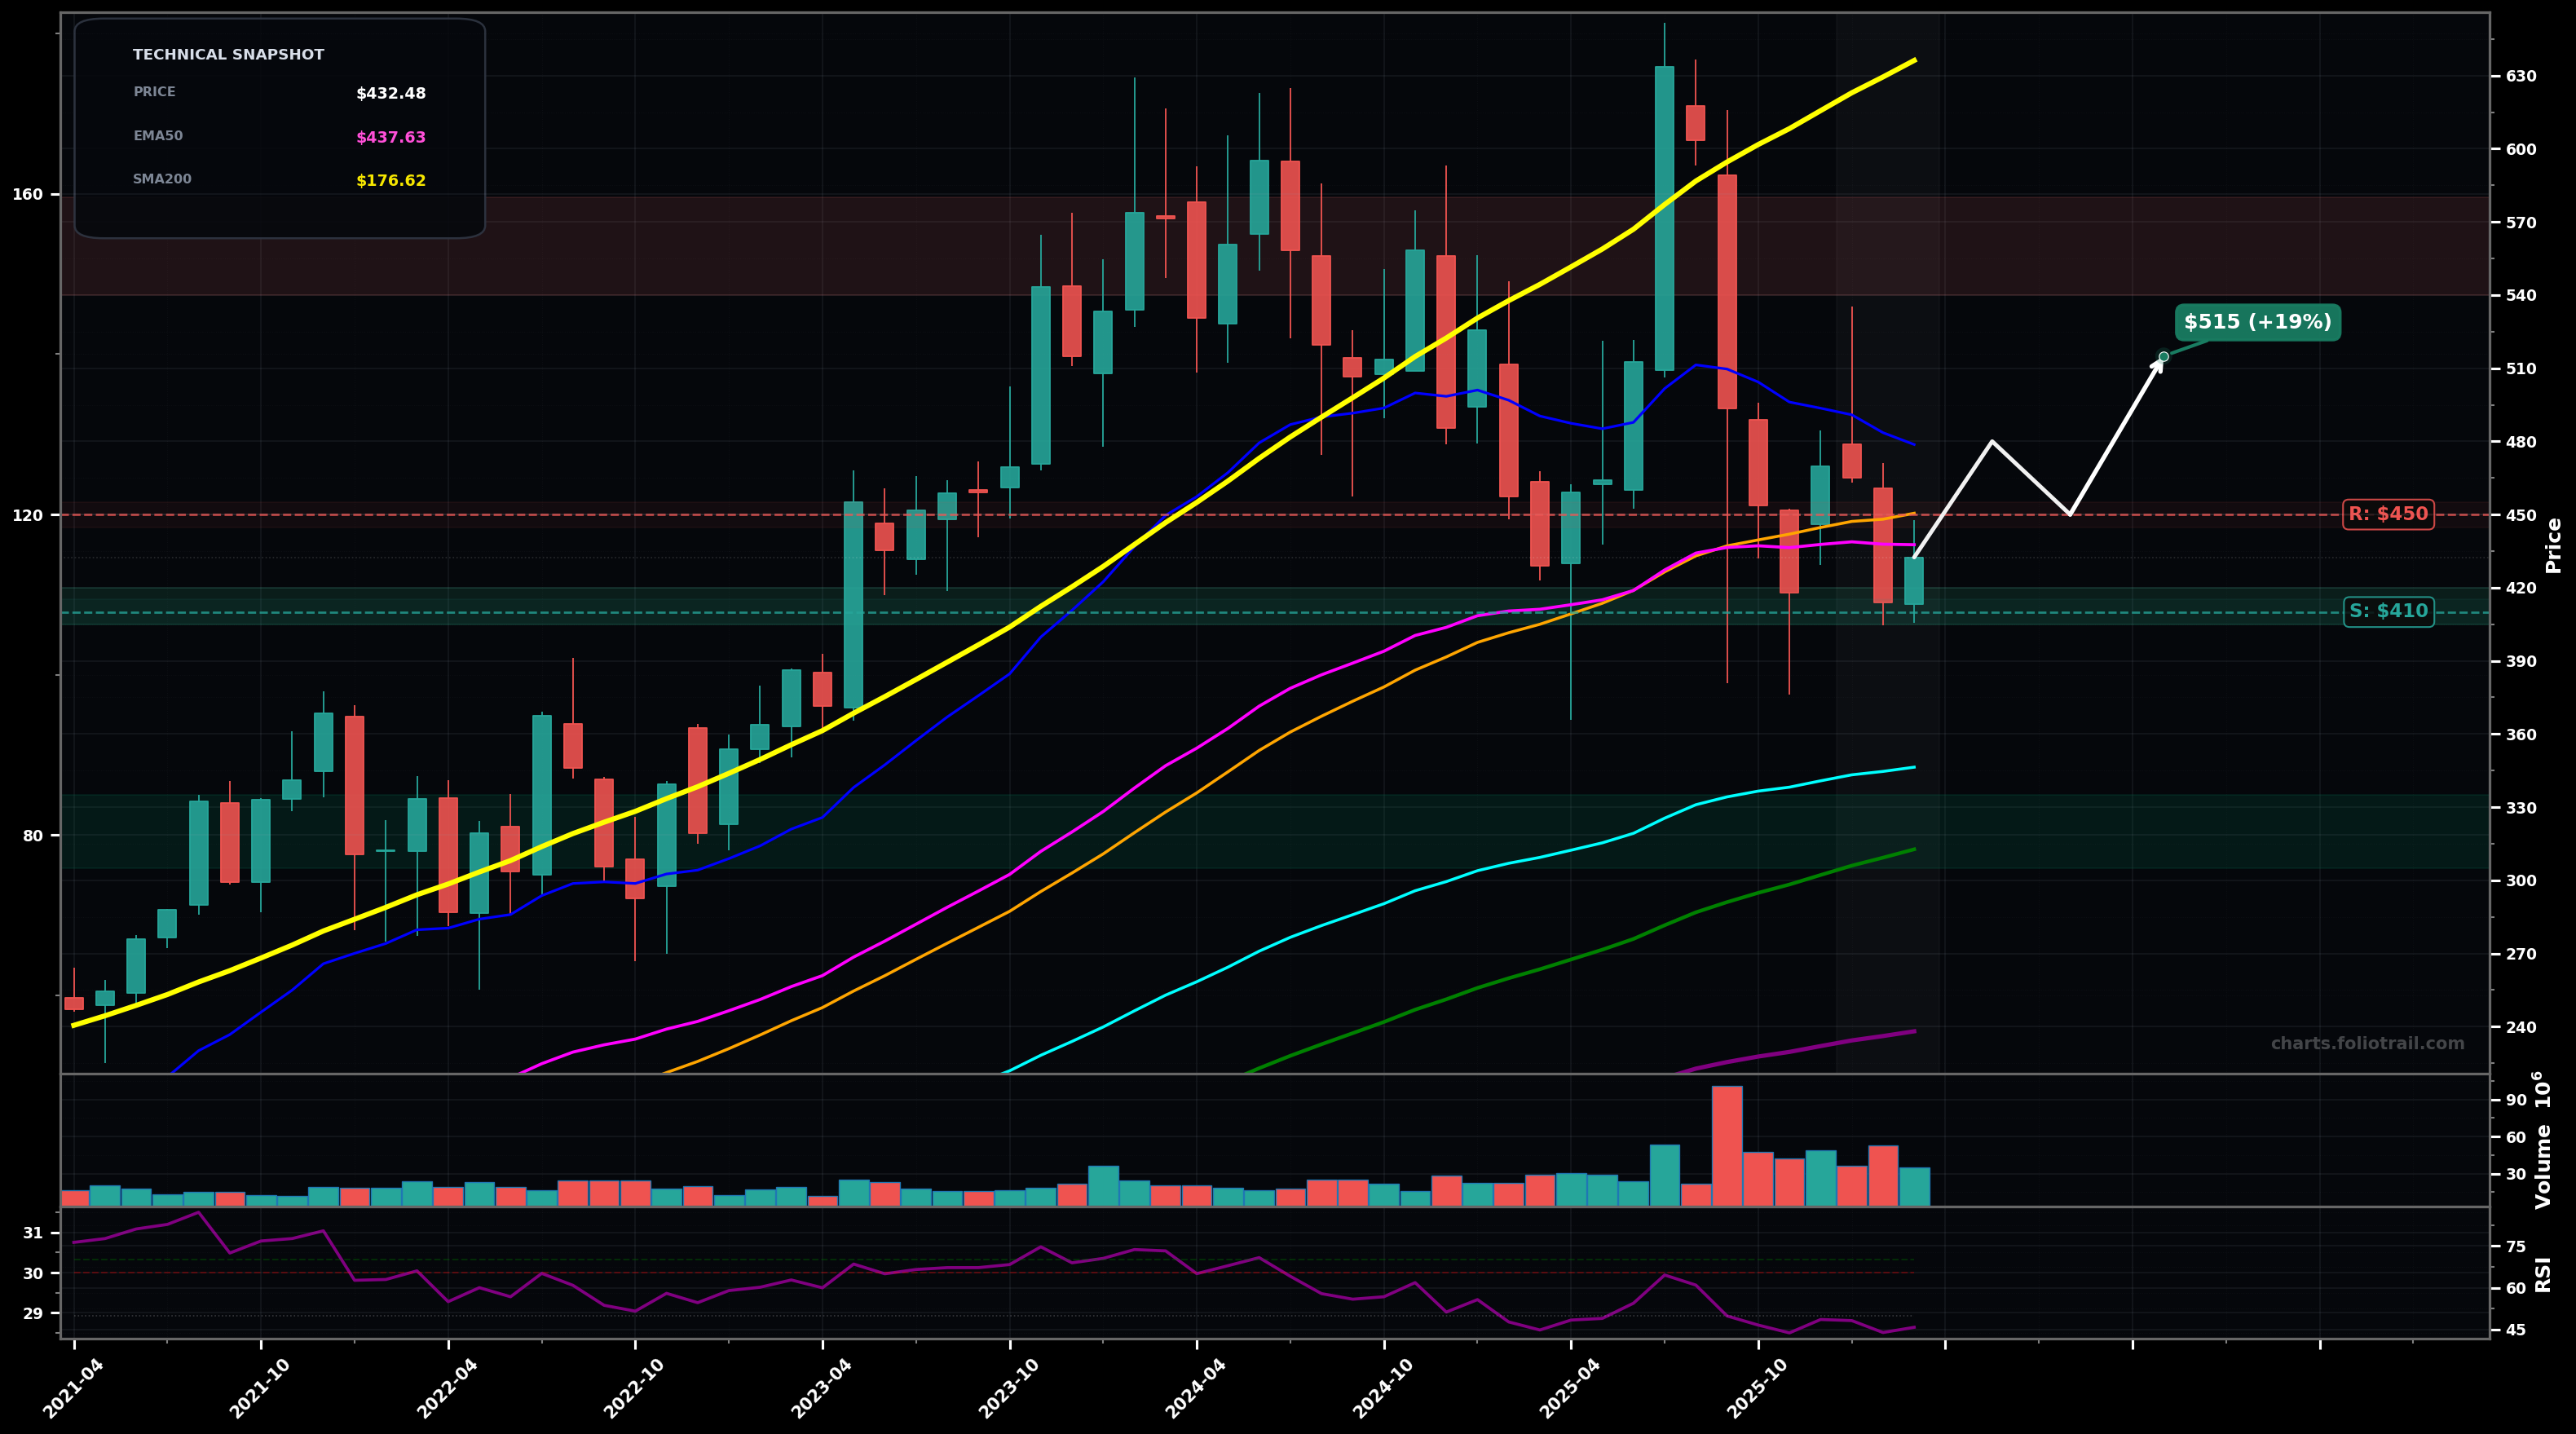
As of March 24, 2026, SNPS (Synopsys, Inc.) is in a bottoming attempt state on the monthly chart, with a confidence level of 56%. Key support is at $410 and key resistance at $450. Monthly pulled back hard from the ~$630 peak, then formed a short sideways-to-down cluster around $420-$460; last candle attempts a small bounce back toward the declining short-term averages.
Base-building continues: price holds $410-$400, reclaims $450, then mean-reverts toward the next supply band (prior breakdown area). Prob. ~60%.
Support fails: monthly close below $400 triggers a continuation leg lower toward the rising long-term averages (EMA200/SMA100 region). Prob. ~40%.
2+ monthly closes back above $450 (reclaim SMA50/near-term supply) with follow-through
Monthly close below $400 (clean break of the current pivot support zone)
Start near current swing-low support ($410 area); add into a breakdown-to-mean-reversion zone toward EMA100 (~$346); heavy add nearer SMA100 (~$313) / deeper Fib retracement of the $630→$400 leg.
Trim into prior distribution/supply ($540-$580), trim more near the prior ATH zone (~$600-$640), and fully close if price becomes materially extended above prior highs where blow-off risk rises.
As of March 24, 2026, SNPS (Synopsys, Inc.) is in a bottoming attempt state on the monthly chart with 56% confidence. Monthly pulled back hard from the ~$630 peak, then formed a short sideways-to-down cluster around $420-$460; last candle attempts a small bounce back toward the declining short-term averages.
On the monthly timeframe, SNPS has key support at $410 and key resistance at $450. The most likely scenario (bullish) targets $480 and $515, with a revert level at $450.
SNPS (Synopsys, Inc.) is currently classified as bottoming attempt on the monthly chart, with 56% confidence. Confirmation requires: 2+ monthly closes back above $450 (reclaim SMA50/near-term supply) with follow-through This would be invalidated by: Monthly close below $400 (clean break of the current pivot support zone)
The most likely scenario (bullish) targets $480 and $515, with a revert level at $450. The alternative scenario (bearish) targets $360 and $315.
All content on this website — including charts, analysis, price targets, support/resistance levels, and position zones — is generated entirely by AI and provided for educational and informational purposes only.
This is not financial advice. NEXUSNOIR VENTURES SL (the operator of this website) is not a registered investment adviser or broker-dealer. You should not make investment decisions based solely on this information. Always do your own research and consult a qualified financial advisor.
By continuing, you acknowledge that you have read and agree to our full disclaimer & terms of use and privacy policy.