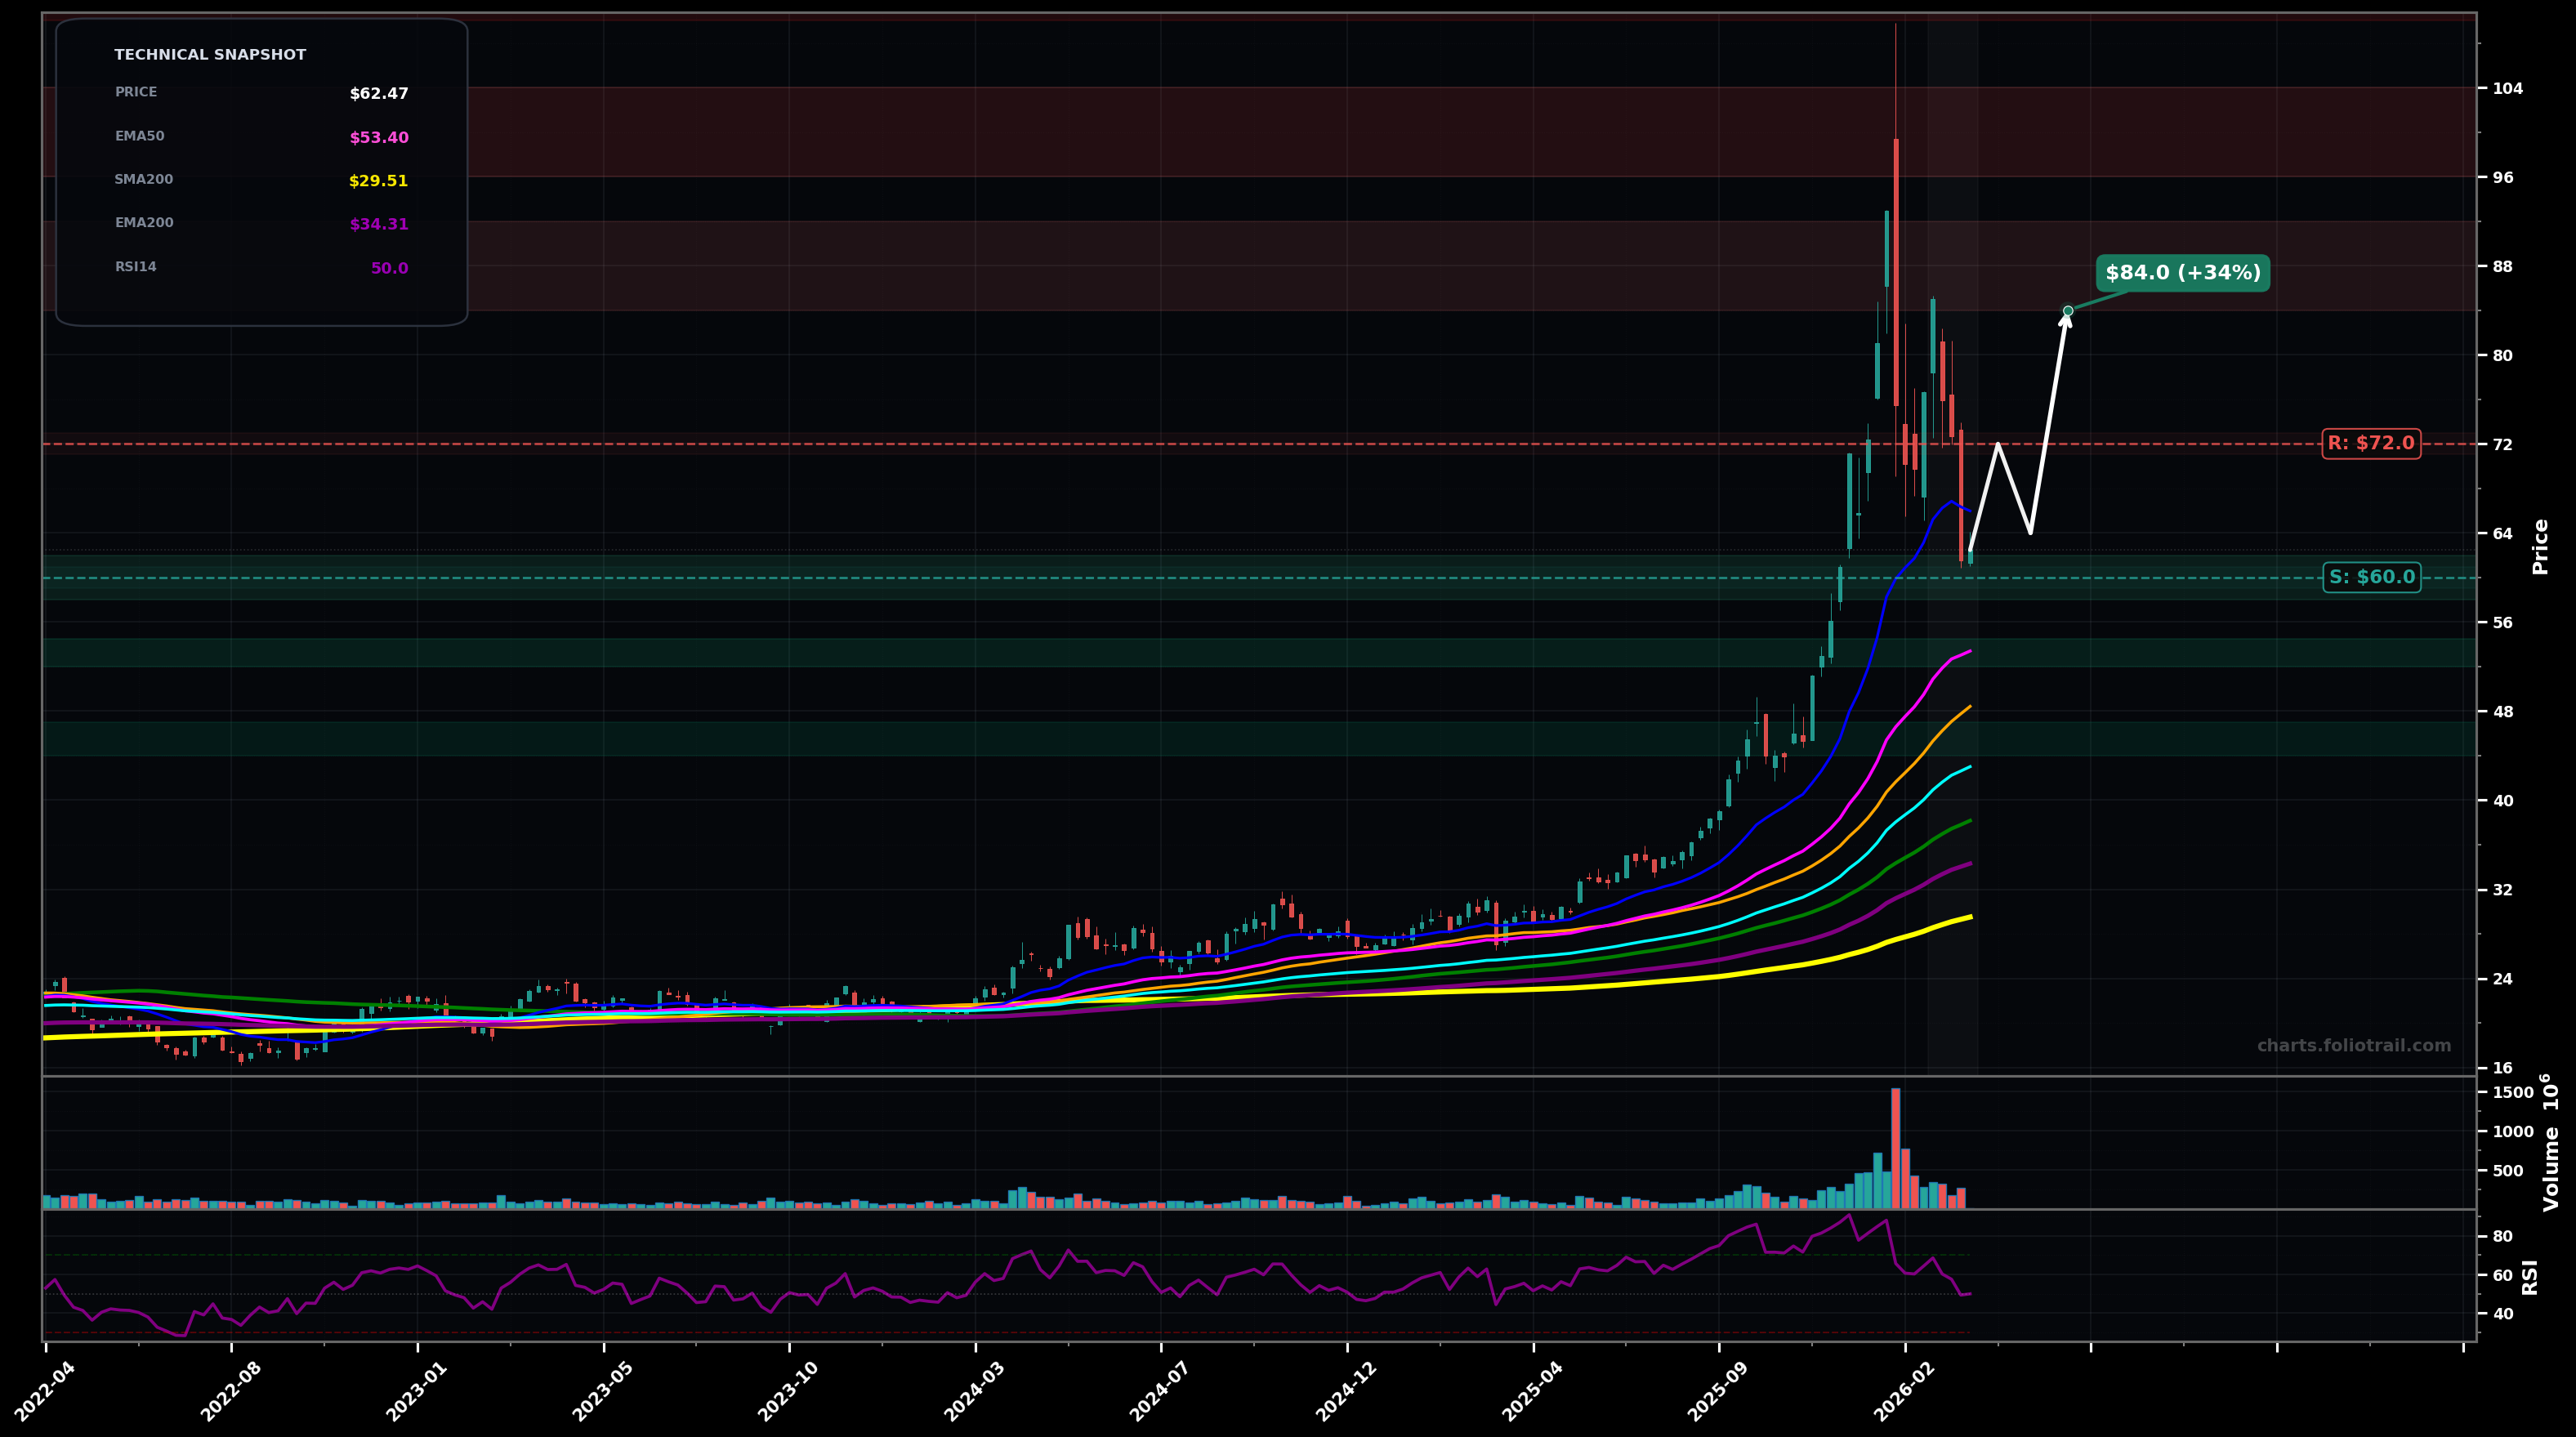
As of March 23, 2026, SLV (iShares Silver Trust) is in a volatility expansion state on the weekly chart, with a confidence level of 67%. Key support is at $60.0 and key resistance at $72.0. Weekly pullback from a blow-off peak (~$100) into the $62 area; still above rising EMA50/EMA100 with RSI ~50 and heavy prior volume spike cooling off.
Bullish consolidation: price holds $60-$62, forms a higher low (HL) above EMA50, then rotates up to retest the $72 supply zone and possibly the mid-$80s (fib retracement of the peak-to-pullback).
Deeper mean-reversion: failure to hold $60 triggers a drop toward EMA50 ~$53 and a larger fib retrace of the run; buyers attempt a base between $50-$54 before any renewed advance.
VOLATILITY_EXPANSION confirmed if weekly ranges stay elevated and price breaks below $60 with follow-through toward EMA50 ~$53.40
This volatility-expansion pullback view is invalidated if price reclaims $72+ and holds 2 weekly closes (shift back to trend continuation)
Start near the current pivot support ($60) for an HL attempt; add at EMA50 mean-reversion; heavy add near deeper fib/structure support if price loses EMA50 and seeks the next demand zone.
Trim into prior blow-off supply/extension zones (upper fib extensions and prior peak area); fully exit only on a fresh multi-year euphoric extension well above the prior ~$100 high.
As of March 23, 2026, SLV (iShares Silver Trust) is in a volatility expansion state on the weekly chart with 67% confidence. Weekly pullback from a blow-off peak (~$100) into the $62 area; still above rising EMA50/EMA100 with RSI ~50 and heavy prior volume spike cooling off.
On the weekly timeframe, SLV has key support at $60.0 and key resistance at $72.0. The most likely scenario (bullish) targets $72.0 and $84.0, with a revert level at $64.0.
SLV (iShares Silver Trust) is currently classified as volatility expansion on the weekly chart, with 67% confidence. Confirmation requires: VOLATILITY_EXPANSION confirmed if weekly ranges stay elevated and price breaks below $60 with follow-through toward EMA50 ~$53.40 This would be invalidated by: This volatility-expansion pullback view is invalidated if price reclaims $72+ and holds 2 weekly closes (shift back to trend continuation)
The most likely scenario (bullish) targets $72.0 and $84.0, with a revert level at $64.0. The alternative scenario (bearish) targets $53.4 and $46.0.
All content on this website — including charts, analysis, price targets, support/resistance levels, and position zones — is generated entirely by AI and provided for educational and informational purposes only.
This is not financial advice. NEXUSNOIR VENTURES SL (the operator of this website) is not a registered investment adviser or broker-dealer. You should not make investment decisions based solely on this information. Always do your own research and consult a qualified financial advisor.
By continuing, you acknowledge that you have read and agree to our full disclaimer & terms of use and privacy policy.