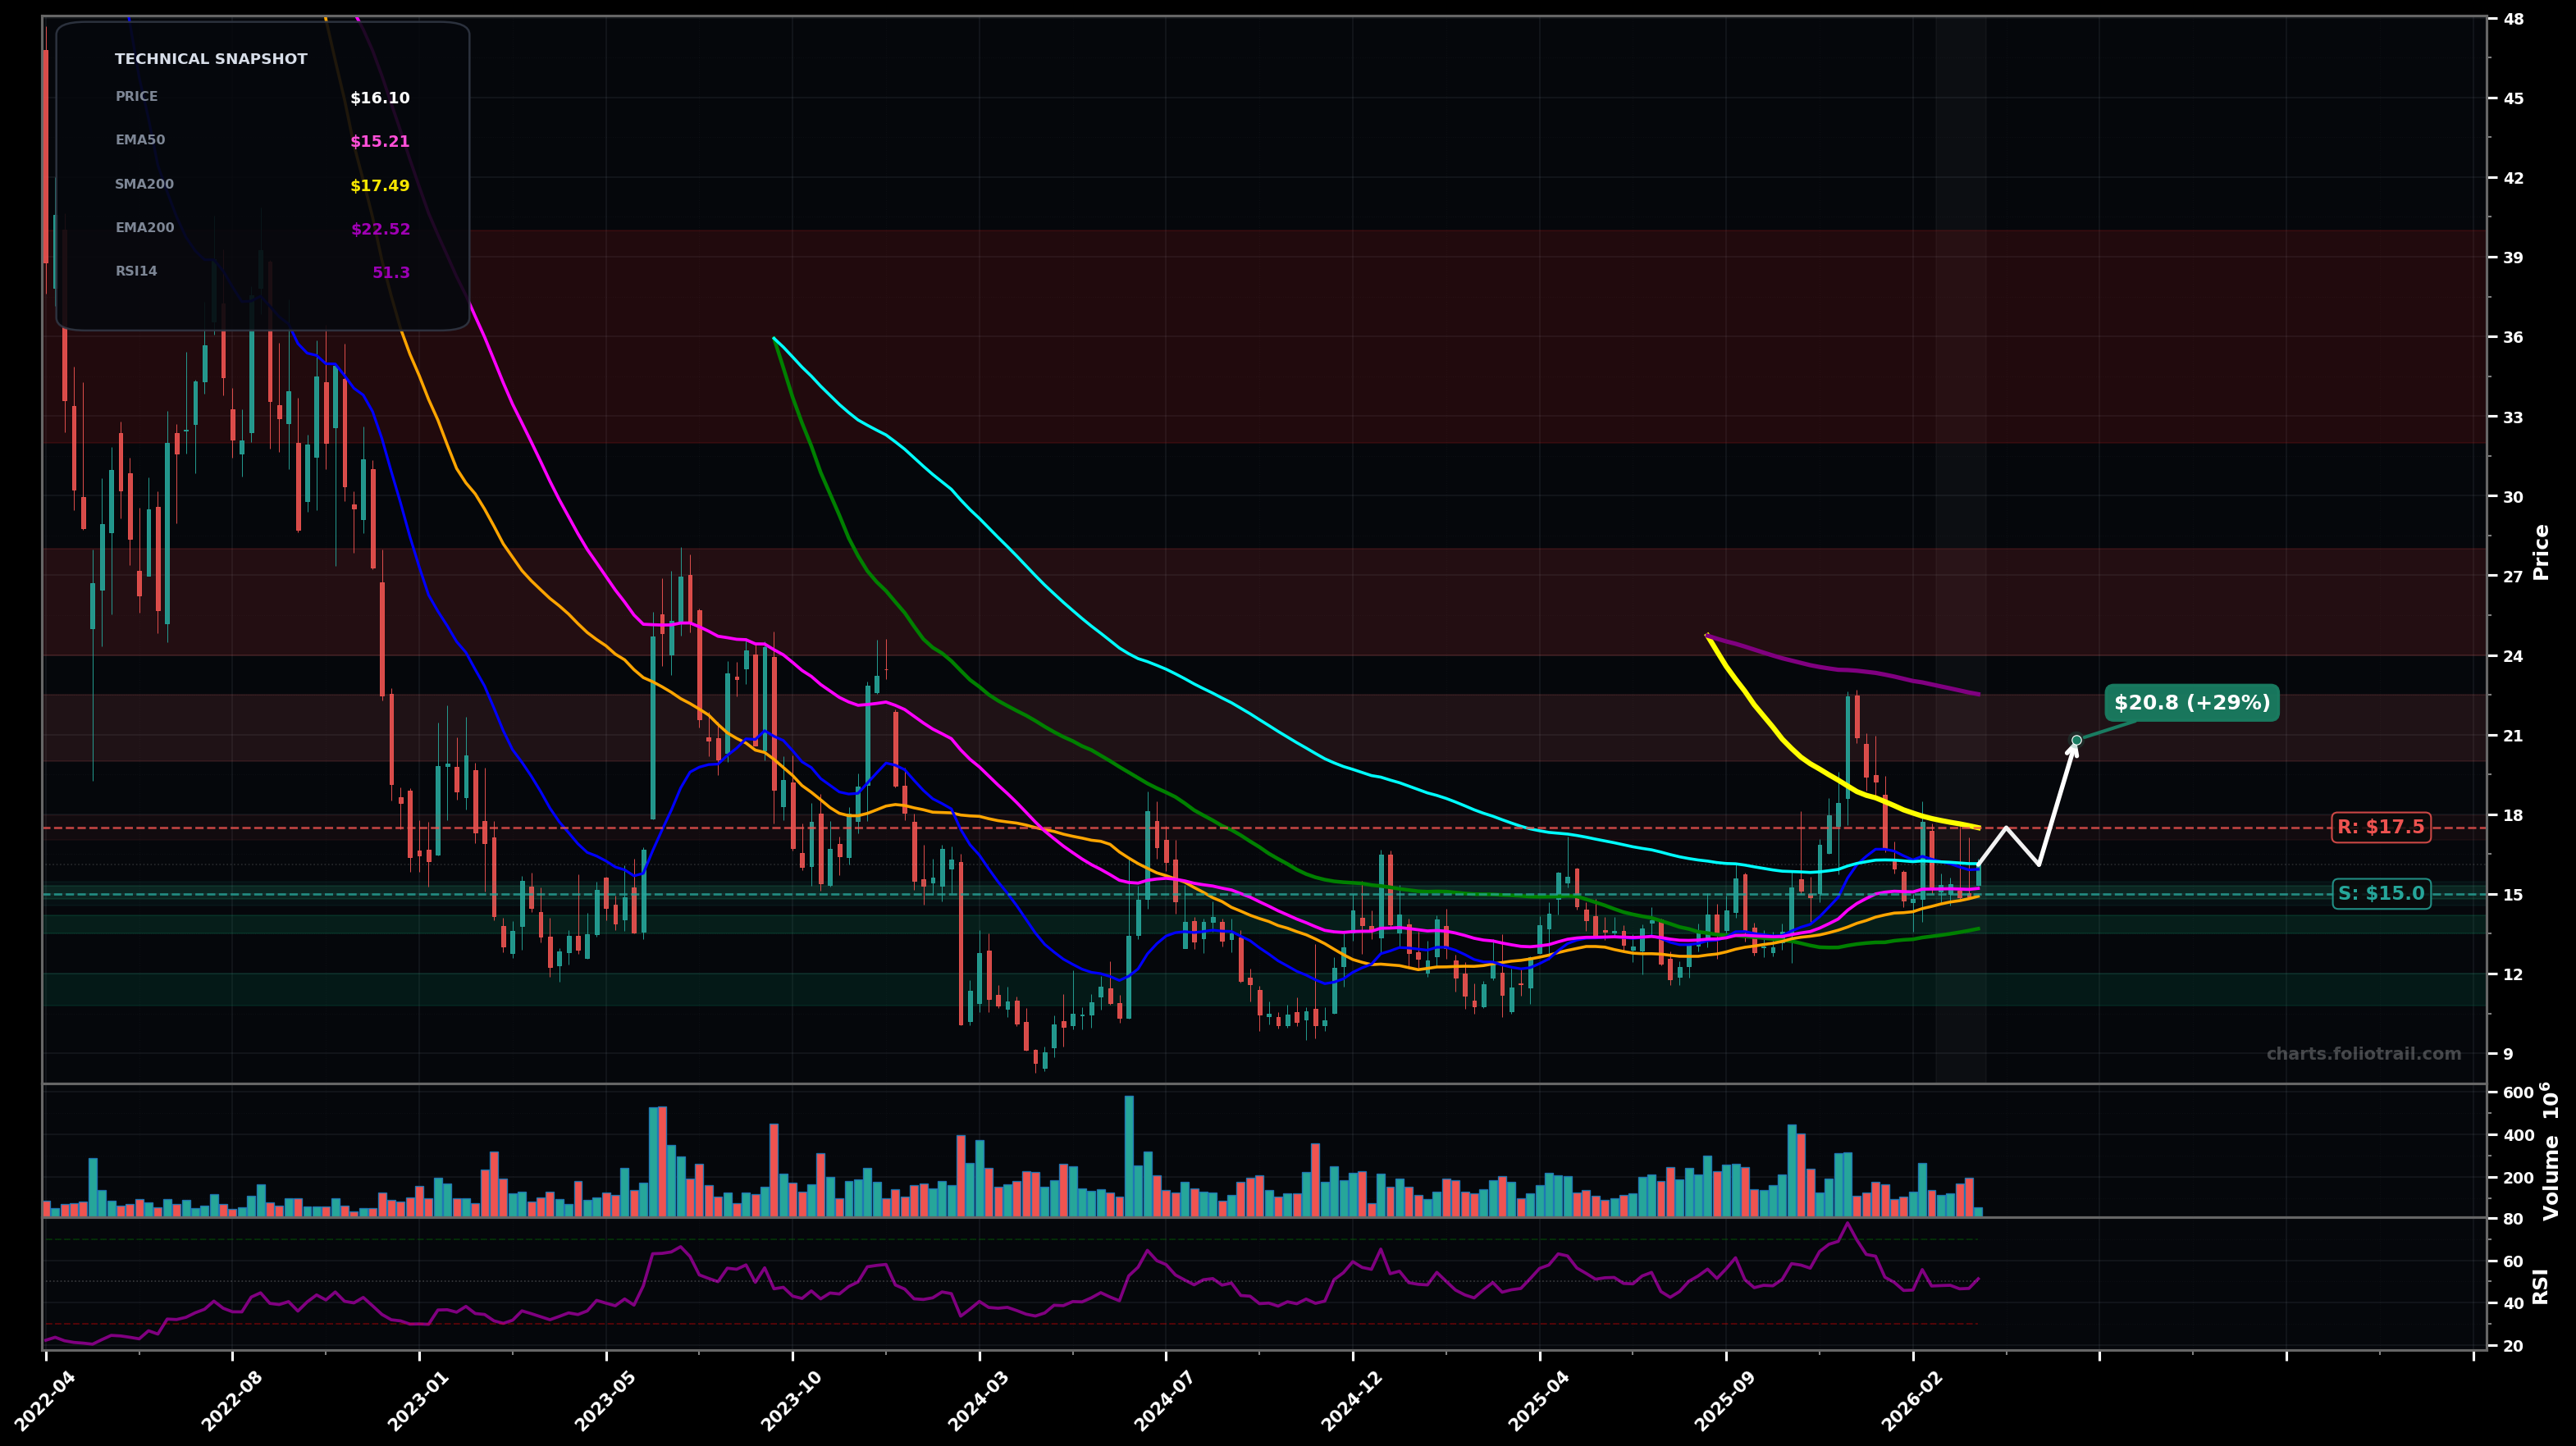
As of March 25, 2026, RIVN (Rivian Automotive, Inc. Class A Common Stock) is in a choppy range state on the weekly chart, with a confidence level of 62%. Key support is at $15.0 and key resistance at $17.5. Weekly pullback after a sharp pop toward the long-term averages; price is consolidating around the $15–$16 zone with RSI ~51 (neutral).
Range continuation: price holds $15 support, grinds higher to test $17.5, and either stalls or briefly wicks above before fading back into the band (typical mean-reversion around SMA/EMAs). Prob ~60%.
Breakdown from the range: loss of $15 leads to a deeper retrace into prior base demand; this would likely be wave (C) of an ABC correction within a larger basing structure. Prob ~40%.
2 weekly closes holding above $17.50 (SMA200 reclaim) would confirm a breakout-reversal attempt
A weekly close below $14.90 (SMA50 area) would invalidate the range-bias and tilt back bearish
Start near $15 (EMA50/SMA50 confluence + range support), add on a clean flush toward prior pivot demand ~$13–$14, heavy add only if a capitulation-style sweep reaches the bigger base ~$11 (risk-managed).
Trim into major overhead supply/MA clusters (SMA200/EMA200 zone then prior breakdown area), close if a full multi-year mean-reversion/rally stretches into the $30s where prior distribution likely returns.
As of March 25, 2026, RIVN (Rivian Automotive, Inc. Class A Common Stock) is in a choppy range state on the weekly chart with 62% confidence. Weekly pullback after a sharp pop toward the long-term averages; price is consolidating around the $15–$16 zone with RSI ~51 (neutral).
On the weekly timeframe, RIVN has key support at $15.0 and key resistance at $17.5. The most likely scenario (bullish) targets $17.5 and $20.8, with a revert level at $16.1.
RIVN (Rivian Automotive, Inc. Class A Common Stock) is currently classified as choppy range on the weekly chart, with 62% confidence. Confirmation requires: 2 weekly closes holding above $17.50 (SMA200 reclaim) would confirm a breakout-reversal attempt This would be invalidated by: A weekly close below $14.90 (SMA50 area) would invalidate the range-bias and tilt back bearish
The most likely scenario (bullish) targets $17.5 and $20.8, with a revert level at $16.1. The alternative scenario (bearish) targets $13.7 and $11.0.
Multi-layer AI agents analyse 200+ stocks across daily, weekly, and monthly timeframes — producing market state classifications, price scenarios with targets, and position entry/exit levels. Updated every trading day after market close. No paywall. No sign-up required.
Built by Foliotrail.
All content on this website — including charts, analysis, price targets, support/resistance levels, and position zones — is generated entirely by AI and provided for educational and informational purposes only.
This is not financial advice. NEXUSNOIR VENTURES SL (the operator of this website) is not a registered investment adviser or broker-dealer. You should not make investment decisions based solely on this information. Always do your own research and consult a qualified financial advisor.
By continuing, you acknowledge that you have read and agree to our full disclaimer & terms of use and privacy policy.