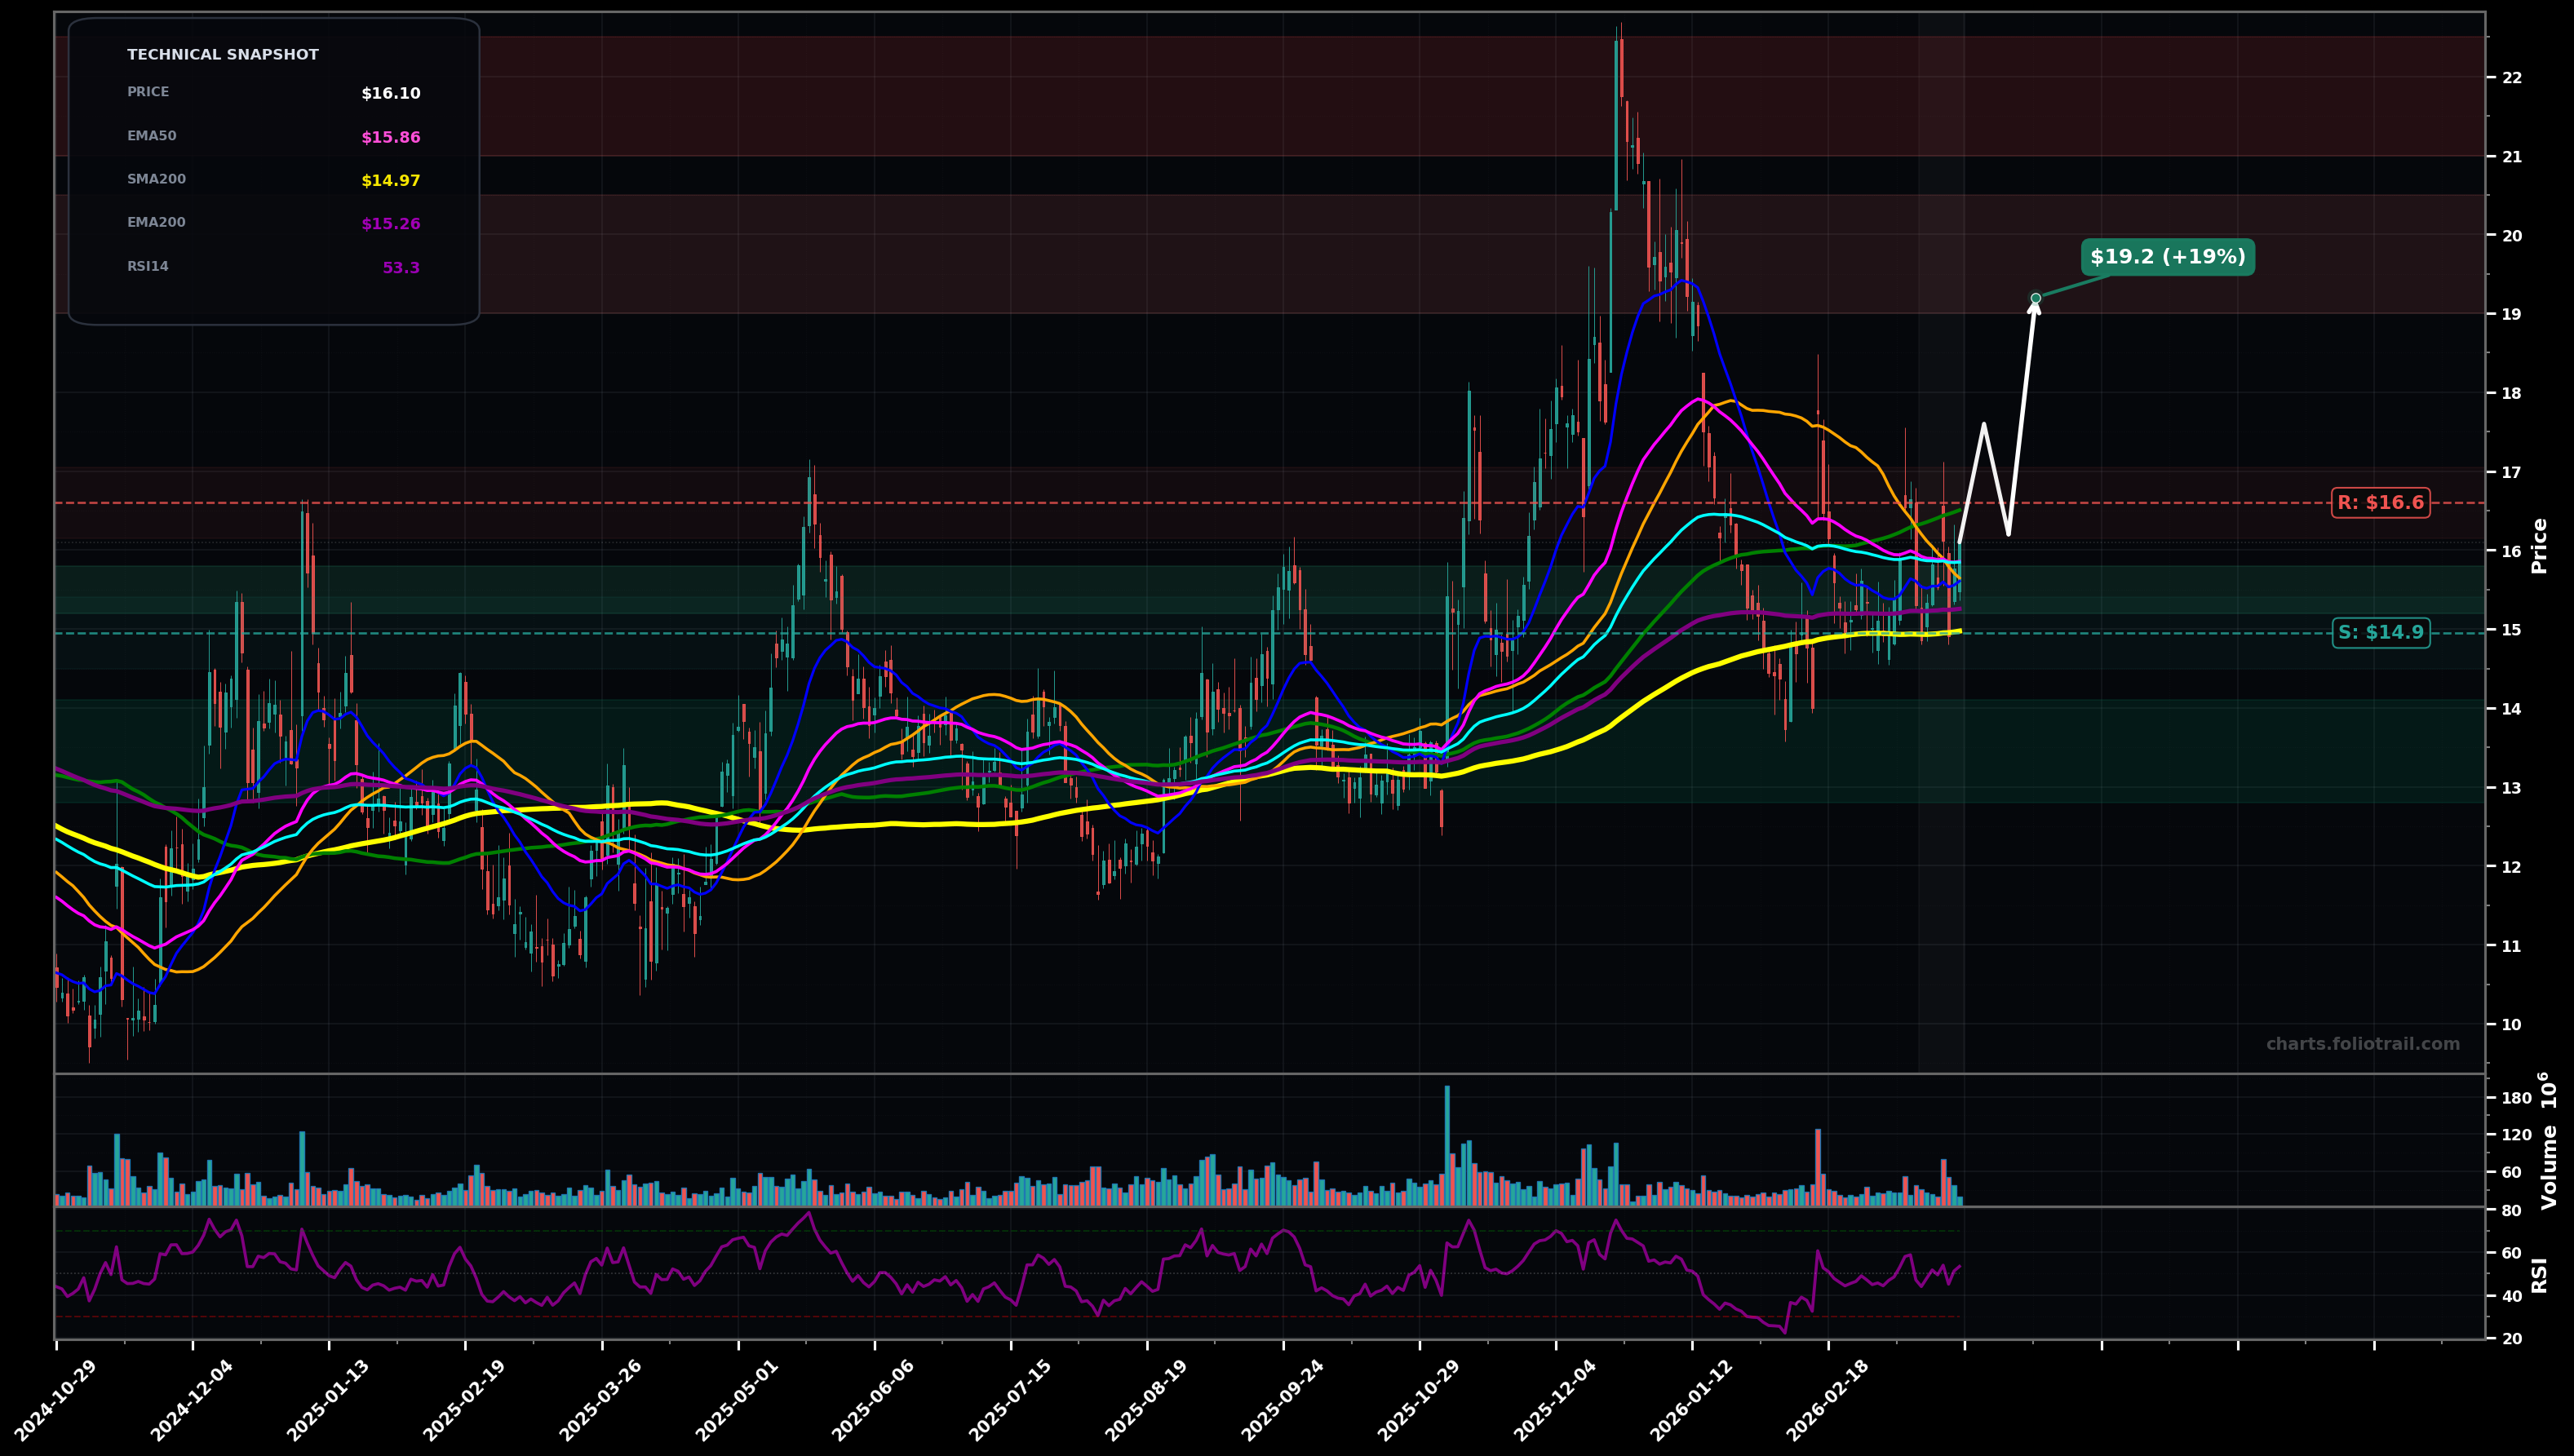
As of May 22, 2026, RIVN (Rivian Automotive, Inc. Class A Common Stock) is in a downtrend state on the daily chart, with a confidence level of 68%. Key support is at $13.1 and key resistance at $15.4. Price at $14.23 bounced off a fresh swing low (~$13.10) but remains below clustered EMA/SMA resistance around $15.10–$15.80; RSI-14 ~45.5 shows weak/neutral momentum after a selloff.
Bear-market bounce stalls into the $15.10–$15.80 MA cluster, then rolls over and retests the swing low; if $13.10 breaks, continuation toward prior demand in the low-$12s.
Bottoming attempt: hold $13.10, build a higher low, then reclaim EMA50/EMA100 and rotate back into the $16s (range top / prior breakdown area).
Daily close below $13.10 would confirm continued downtrend with another LL.
2+ daily closes back above $15.50 would invalidate the current downtrend bias and favor a reversal/base-breakout.
Start near post-bounce support above the swing low; add on controlled retest/undercut of $13.10; heavy add only at deeper prior demand where risk/reward improves if selling persists.
Trim into likely Fibonacci/previous-peak supply zones from the prior impulse (and where price would be extended above the MA cluster); full exit near the prior spike/major overhead supply in the low-$20s.
As of May 22, 2026, RIVN (Rivian Automotive, Inc. Class A Common Stock) is in a downtrend state on the daily chart with 68% confidence. Price at $14.23 bounced off a fresh swing low (~$13.10) but remains below clustered EMA/SMA resistance around $15.10–$15.80; RSI-14 ~45.5 shows weak/neutral momentum after a selloff.
On the daily timeframe, RIVN has key support at $13.1 and key resistance at $15.4. The most likely scenario (bearish) targets $15.1 and $13.1, with a revert level at $15.6.
RIVN (Rivian Automotive, Inc. Class A Common Stock) is currently classified as downtrend on the daily chart, with 68% confidence. Confirmation requires: Daily close below $13.10 would confirm continued downtrend with another LL. This would be invalidated by: 2+ daily closes back above $15.50 would invalidate the current downtrend bias and favor a reversal/base-breakout.
The most likely scenario (bearish) targets $15.1 and $13.1, with a revert level at $15.6. The alternative scenario (bullish) targets $15.5 and $16.7.
Multi-layer AI agents analyse 200+ stocks across daily, weekly, and monthly timeframes — producing market state classifications, price scenarios with targets, and position entry/exit levels. Daily charts updated every trading day at 6 PM ET. Weekly charts refresh Fridays. Monthly charts refresh on the last trading day of each month. No paywall. No sign-up required.
Built by Foliotrail.
All content on this website — including charts, analysis, price targets, support/resistance levels, and position zones — is generated entirely by AI and provided for educational and informational purposes only.
This is not financial advice. NEXUSNOIR VENTURES SL (the operator of this website) is not a registered investment adviser or broker-dealer. You should not make investment decisions based solely on this information. Always do your own research and consult a qualified financial advisor.
By continuing, you acknowledge that you have read and agree to our full disclaimer & terms of use and privacy policy.