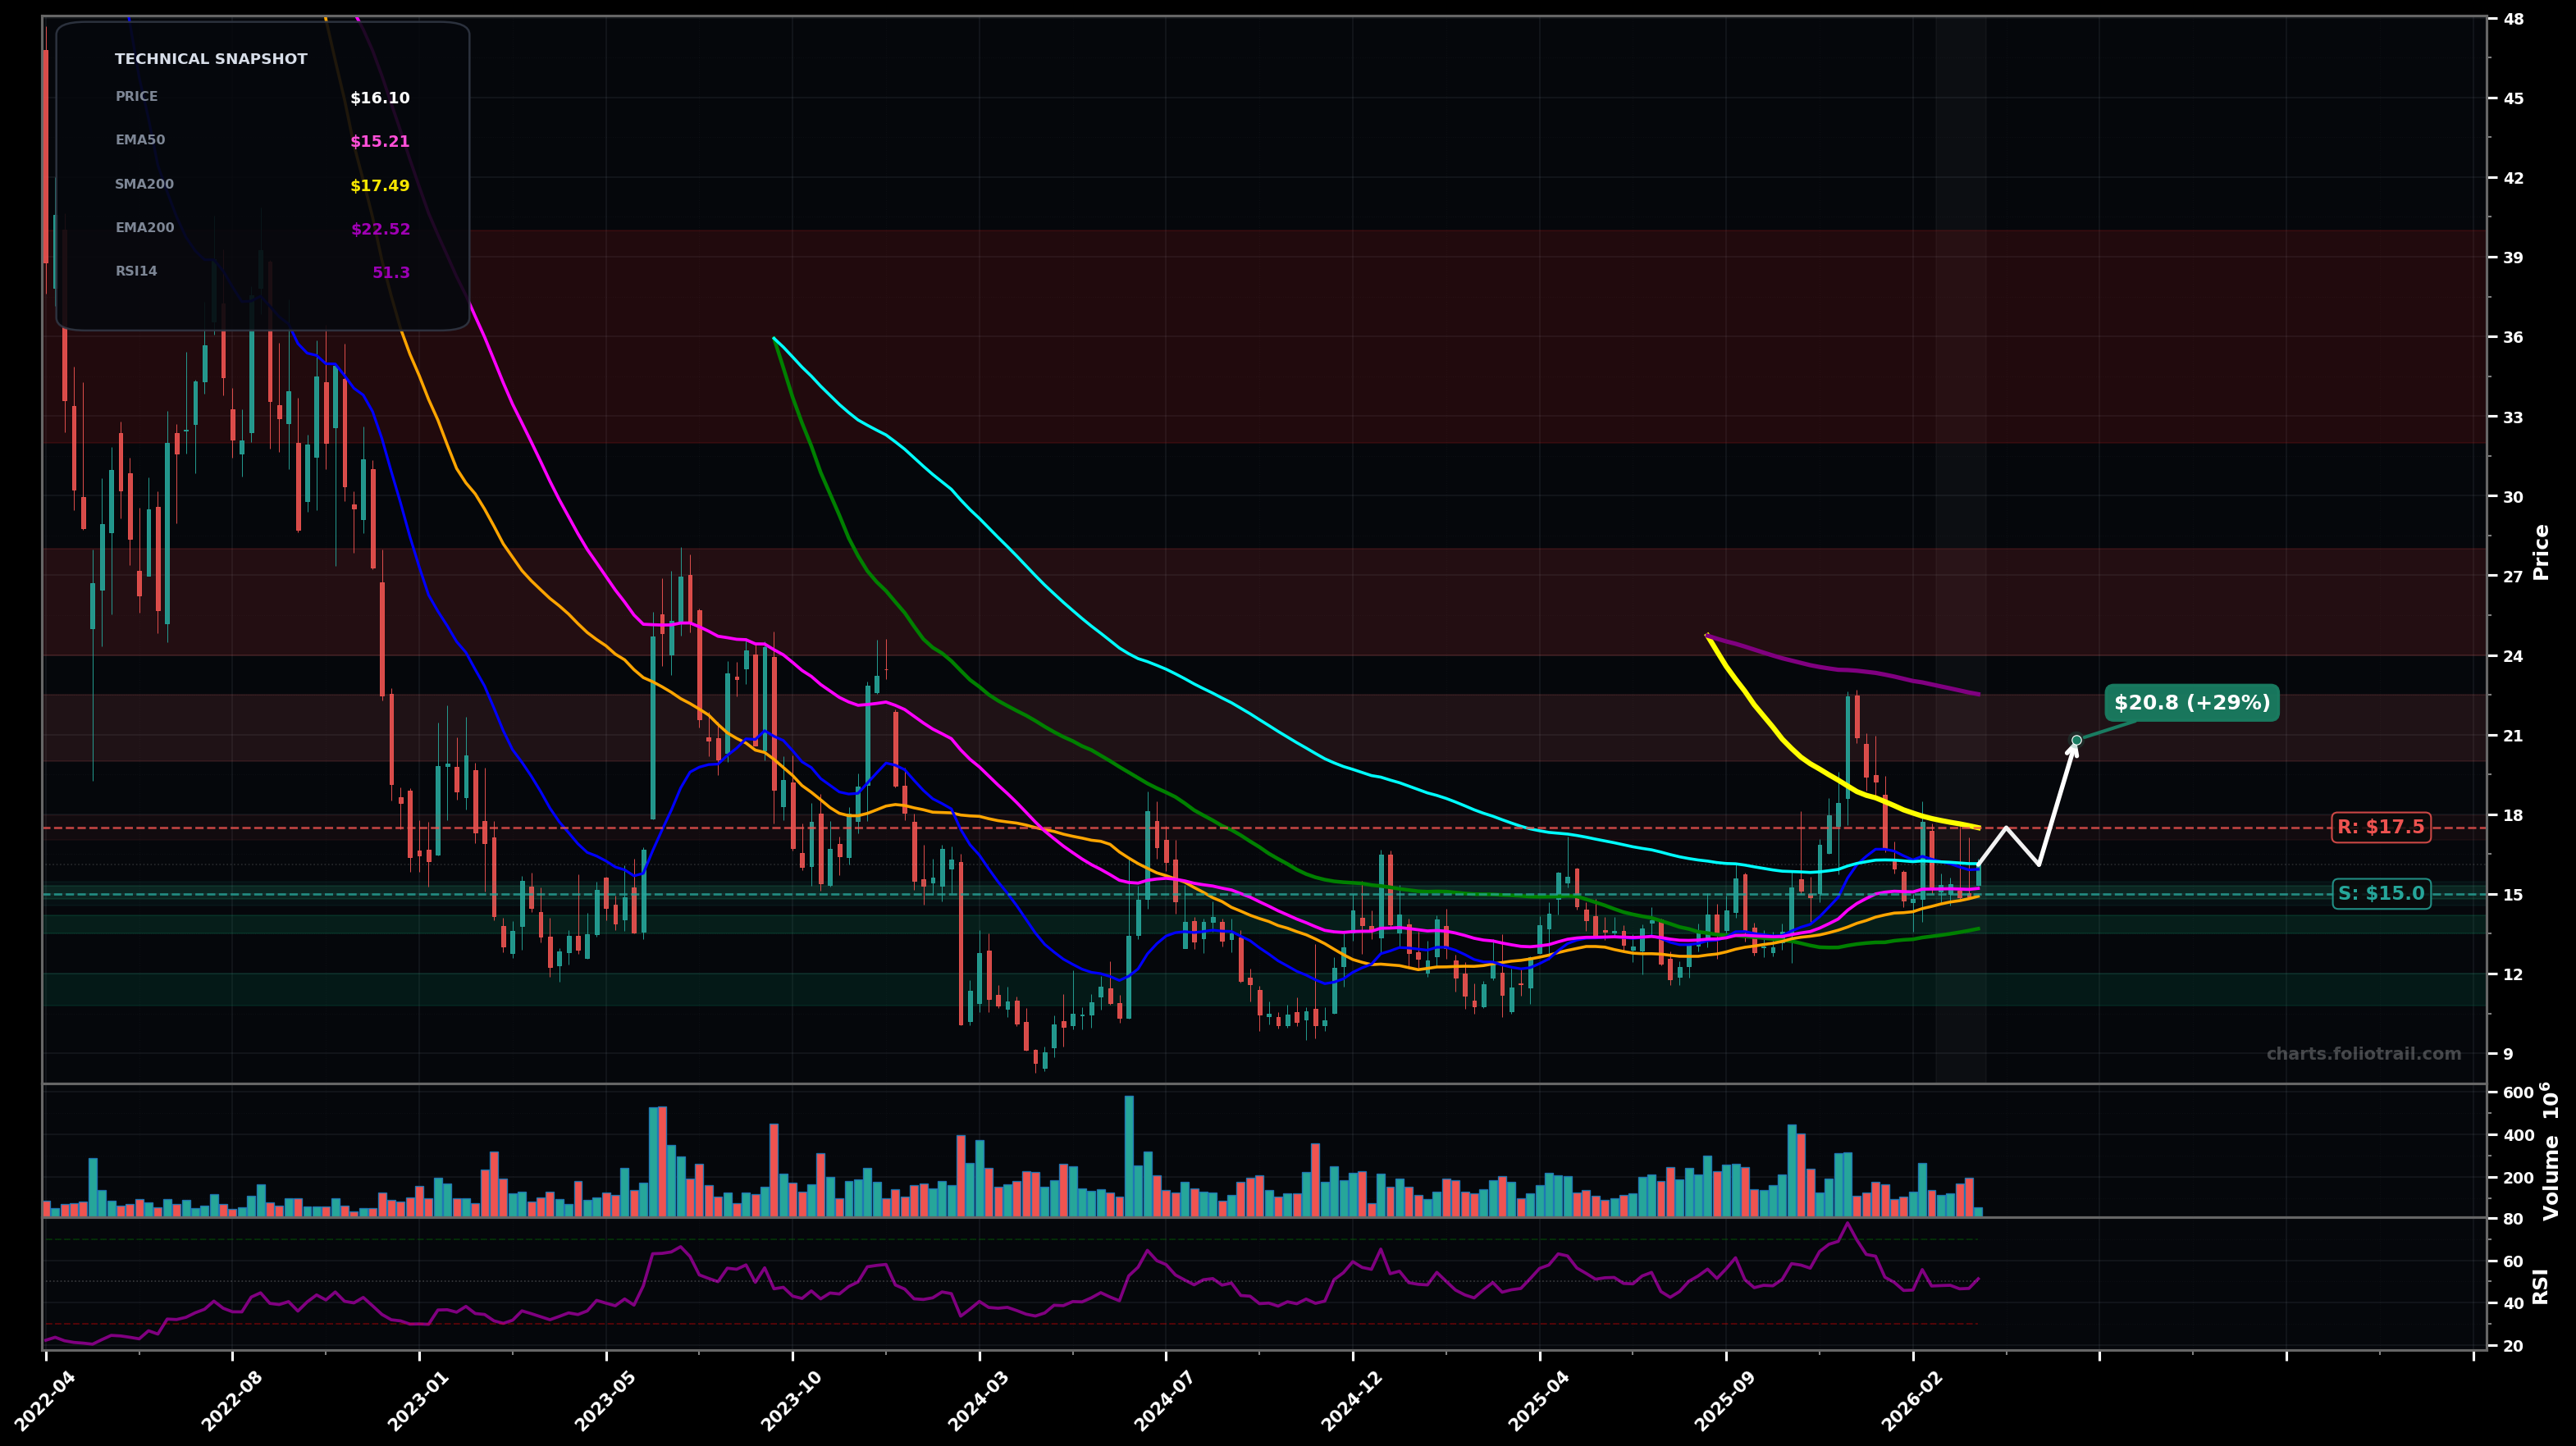
As of May 22, 2026, RIVN (Rivian Automotive, Inc. Class A Common Stock) is in a downtrend state on the weekly chart, with a confidence level of 63%. Key support is at $14.0 and key resistance at $16.3. Weekly price is ~$14.23, back below EMA50/EMA100 and sitting near the ~$14 support shelf after failing the late-2025 rally; RSI-14 ~44.7 (weak/neutral).
Base-building attempt: hold ~$14 support, then mean-revert toward the clustered MAs (EMA50/EMA100) with choppy action; if rejected, price likely rotates back to retest the base again before any sustained upside.
Continuation down: lose ~$14 support decisively and slide to the next demand zone (prior pivot/basing area); this would fit an Elliott-style larger corrective leg (C or 5) still unfolding after the failed rally.
Weekly close below $13.80 (clear breakdown of the current support shelf).
Two consecutive weekly closes above $16.30 (reclaim/hold of EMA100).
Scale near weekly swing support (~$14) first; add on breakdown-to-retest/next pivot support (~$12.5); heavy add only at deeper support where prior lows/likely fib extension demand sits (~$10.5–$11.3).
Trim into overhead MA supply + prior breakdown zone (~$17–$18), then the prior rally peak area (~$20–$22.5); fully close only if price becomes extremely stretched into the distant EMA200 zone (~$27–$30).
As of May 22, 2026, RIVN (Rivian Automotive, Inc. Class A Common Stock) is in a downtrend state on the weekly chart with 63% confidence. Weekly price is ~$14.23, back below EMA50/EMA100 and sitting near the ~$14 support shelf after failing the late-2025 rally; RSI-14 ~44.7 (weak/neutral).
On the weekly timeframe, RIVN has key support at $14.0 and key resistance at $16.3. The most likely scenario (bullish) targets $15.2 and $16.9, with a revert level at $14.6.
RIVN (Rivian Automotive, Inc. Class A Common Stock) is currently classified as downtrend on the weekly chart, with 63% confidence. Confirmation requires: Weekly close below $13.80 (clear breakdown of the current support shelf). This would be invalidated by: Two consecutive weekly closes above $16.30 (reclaim/hold of EMA100).
The most likely scenario (bullish) targets $15.2 and $16.9, with a revert level at $14.6. The alternative scenario (bearish) targets $12.6 and $10.8.
Multi-layer AI agents analyse 200+ stocks across daily, weekly, and monthly timeframes — producing market state classifications, price scenarios with targets, and position entry/exit levels. Daily charts updated every trading day at 6 PM ET. Weekly charts refresh Fridays. Monthly charts refresh on the last trading day of each month. No paywall. No sign-up required.
Built by Foliotrail.
All content on this website — including charts, analysis, price targets, support/resistance levels, and position zones — is generated entirely by AI and provided for educational and informational purposes only.
This is not financial advice. NEXUSNOIR VENTURES SL (the operator of this website) is not a registered investment adviser or broker-dealer. You should not make investment decisions based solely on this information. Always do your own research and consult a qualified financial advisor.
By continuing, you acknowledge that you have read and agree to our full disclaimer & terms of use and privacy policy.