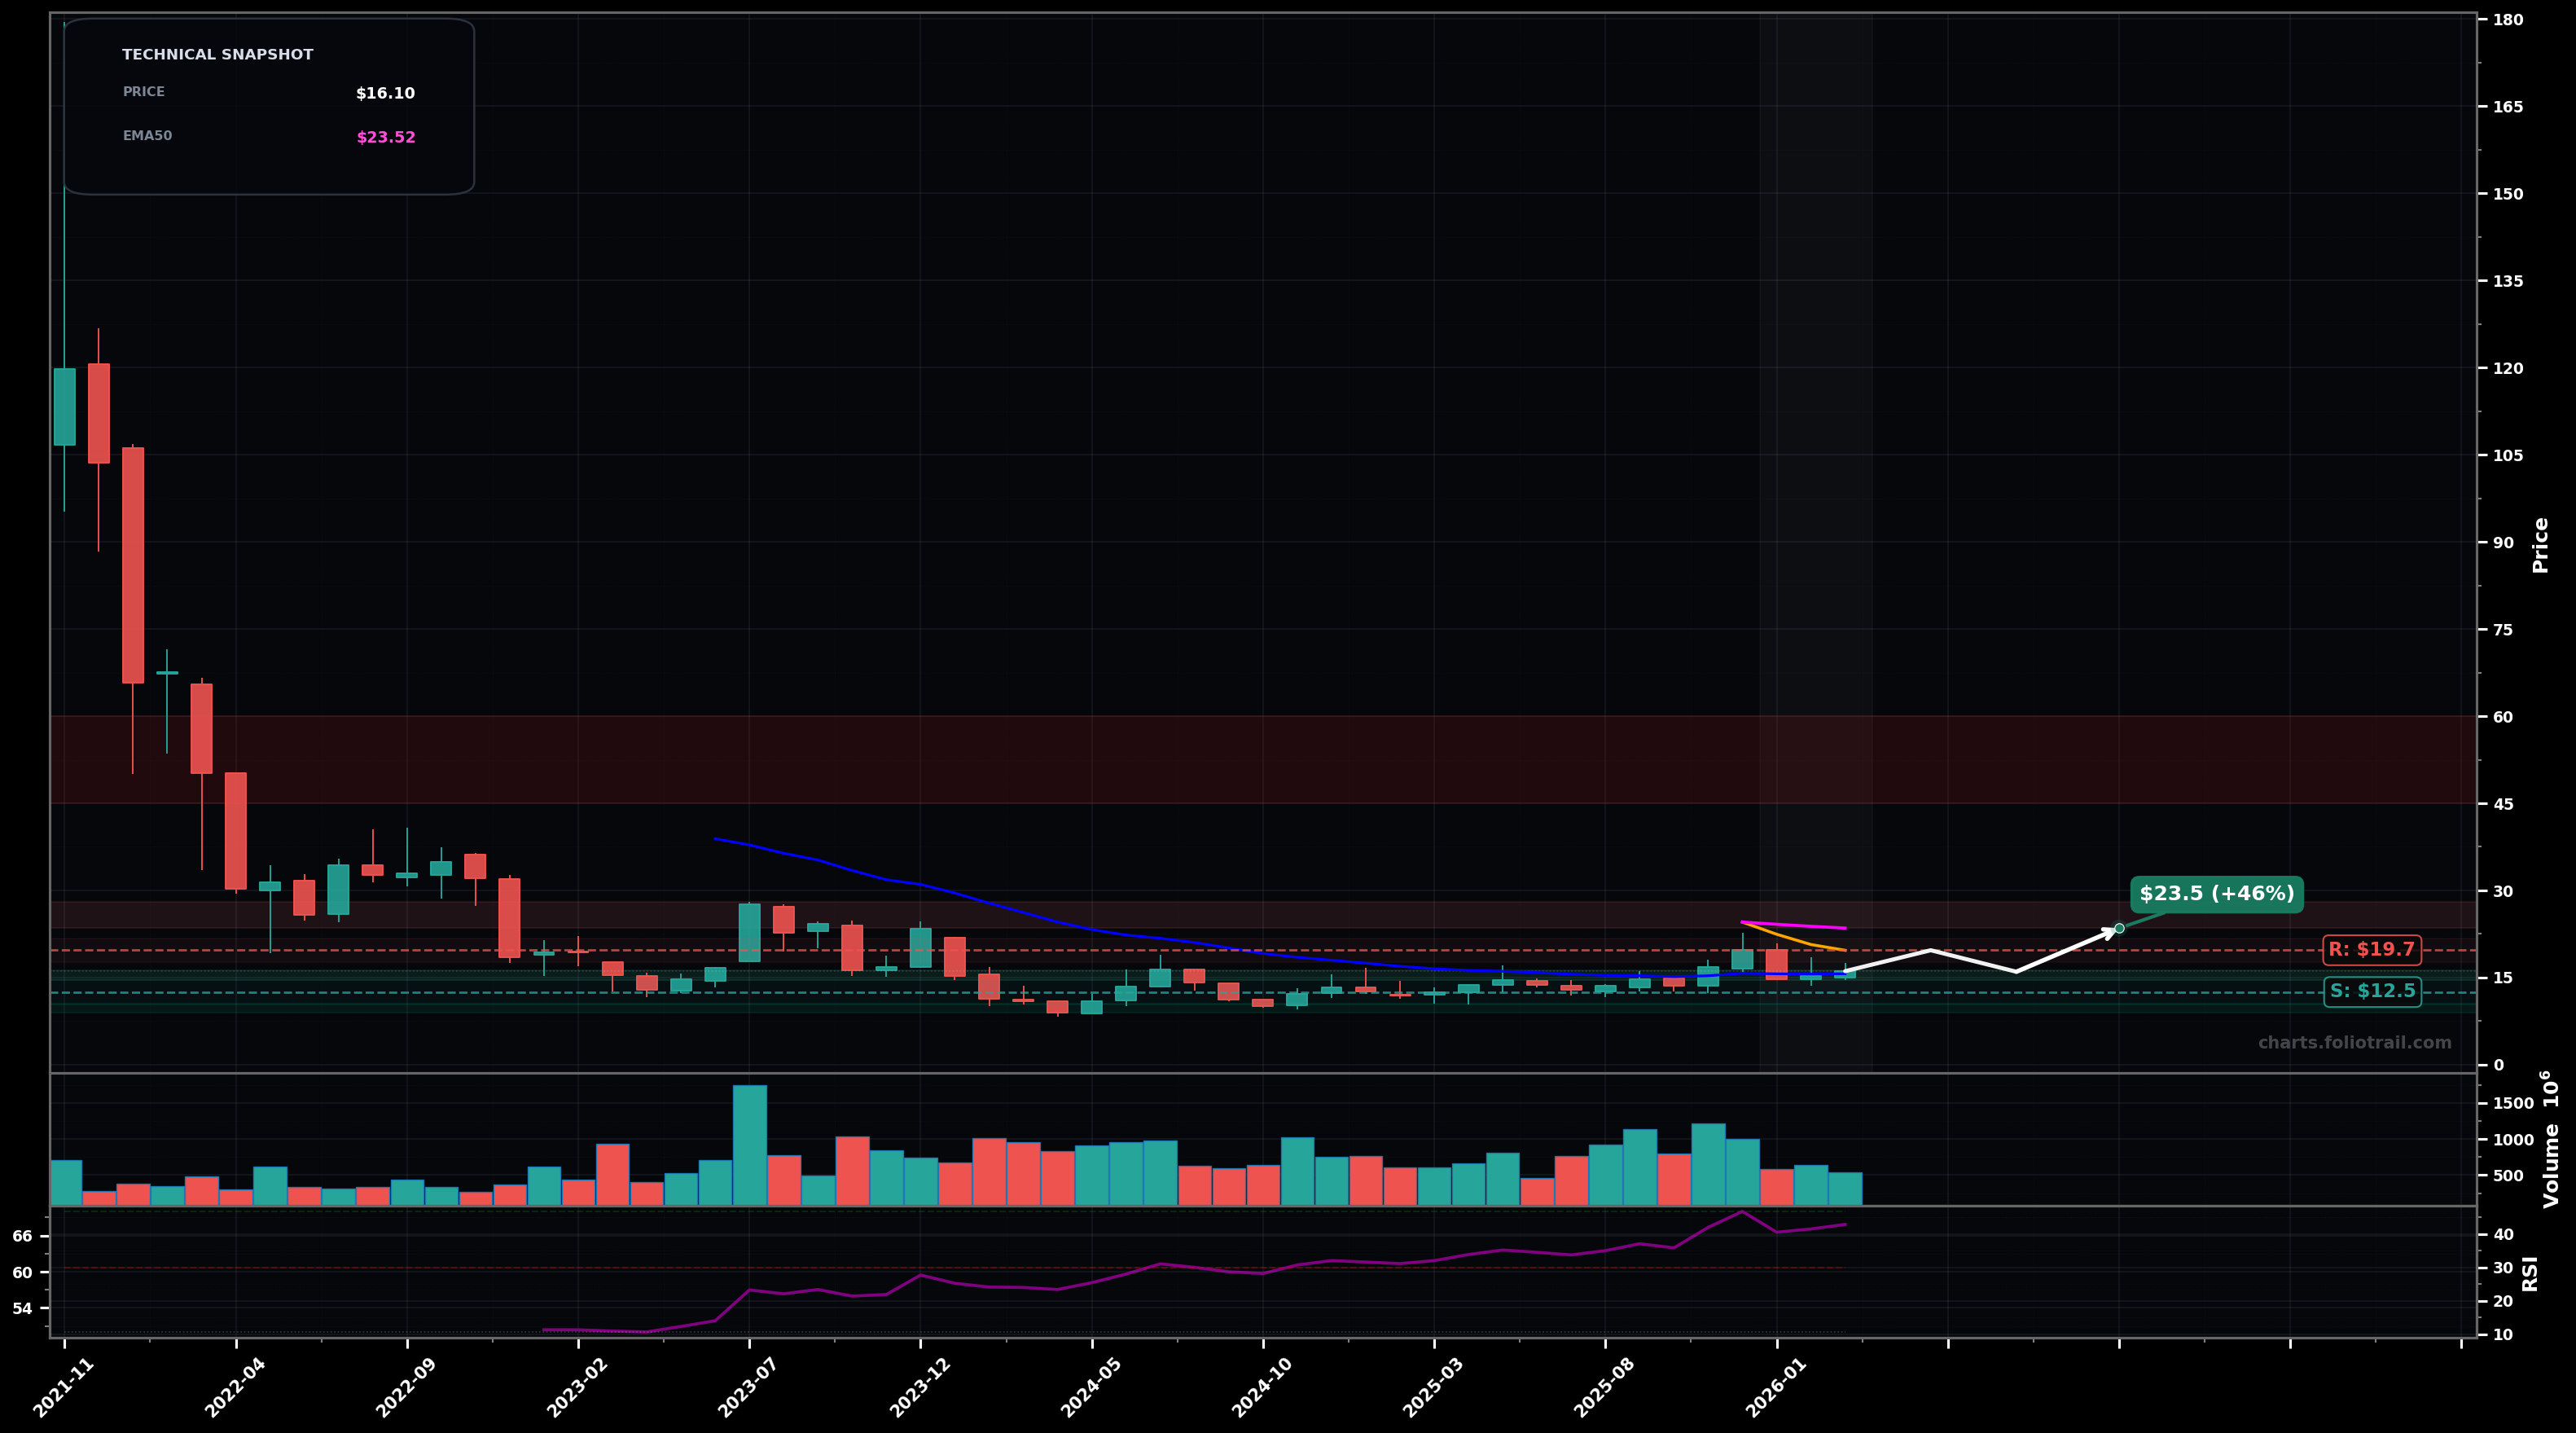
As of April 30, 2026, RIVN (Rivian Automotive, Inc. Class A Common Stock) is in a choppy range state on the monthly chart, with a confidence level of 66%. Key support is at $15.0 and key resistance at $18.6. Monthly close around $16.39 after a small pop toward the mid-$18s; price still capped under clustered short/mid MAs with RSI ~48 (neutral).
Range continuation: price holds the $15 area (EMA200 zone) and grinds back toward the $18.6-$20 supply; only a slow basing process unless it can reclaim/hold above SMA50.
Support failure: a loss of the ~$15 pivot leads to a retest of the prior swing low zone; that would fit an Elliott ABC-style continuation leg down from the larger 2021-2022 impulse selloff.
2+ monthly closes above $18.64 (SMA50) would confirm a breakout reversal attempt
Monthly close below $14.50 would invalidate the range and shift bias back toward a renewed downtrend
Start near the $15 swing-low/EMA200 magnet; add if breakdown tags prior demand; heavy add near deeper capitulation support where risk/reward improves.
Trim into successive overhead supply bands from prior structure; larger trims as price approaches the higher MAs/older breakdown zones where mean-reversion risk rises.
As of April 30, 2026, RIVN (Rivian Automotive, Inc. Class A Common Stock) is in a choppy range state on the monthly chart with 66% confidence. Monthly close around $16.39 after a small pop toward the mid-$18s; price still capped under clustered short/mid MAs with RSI ~48 (neutral).
On the monthly timeframe, RIVN has key support at $15.0 and key resistance at $18.6. The most likely scenario (bullish) targets $18.6 and $20.5, with a revert level at $16.0.
RIVN (Rivian Automotive, Inc. Class A Common Stock) is currently classified as choppy range on the monthly chart, with 66% confidence. Confirmation requires: 2+ monthly closes above $18.64 (SMA50) would confirm a breakout reversal attempt This would be invalidated by: Monthly close below $14.50 would invalidate the range and shift bias back toward a renewed downtrend
The most likely scenario (bullish) targets $18.6 and $20.5, with a revert level at $16.0. The alternative scenario (bearish) targets $14.0 and $12.0.
Multi-layer AI agents analyse 200+ stocks across daily, weekly, and monthly timeframes — producing market state classifications, price scenarios with targets, and position entry/exit levels. Daily charts updated every trading day at 6 PM ET. Weekly charts refresh Fridays. Monthly charts refresh on the last trading day of each month. No paywall. No sign-up required.
Built by Foliotrail.
All content on this website — including charts, analysis, price targets, support/resistance levels, and position zones — is generated entirely by AI and provided for educational and informational purposes only.
This is not financial advice. NEXUSNOIR VENTURES SL (the operator of this website) is not a registered investment adviser or broker-dealer. You should not make investment decisions based solely on this information. Always do your own research and consult a qualified financial advisor.
By continuing, you acknowledge that you have read and agree to our full disclaimer & terms of use and privacy policy.