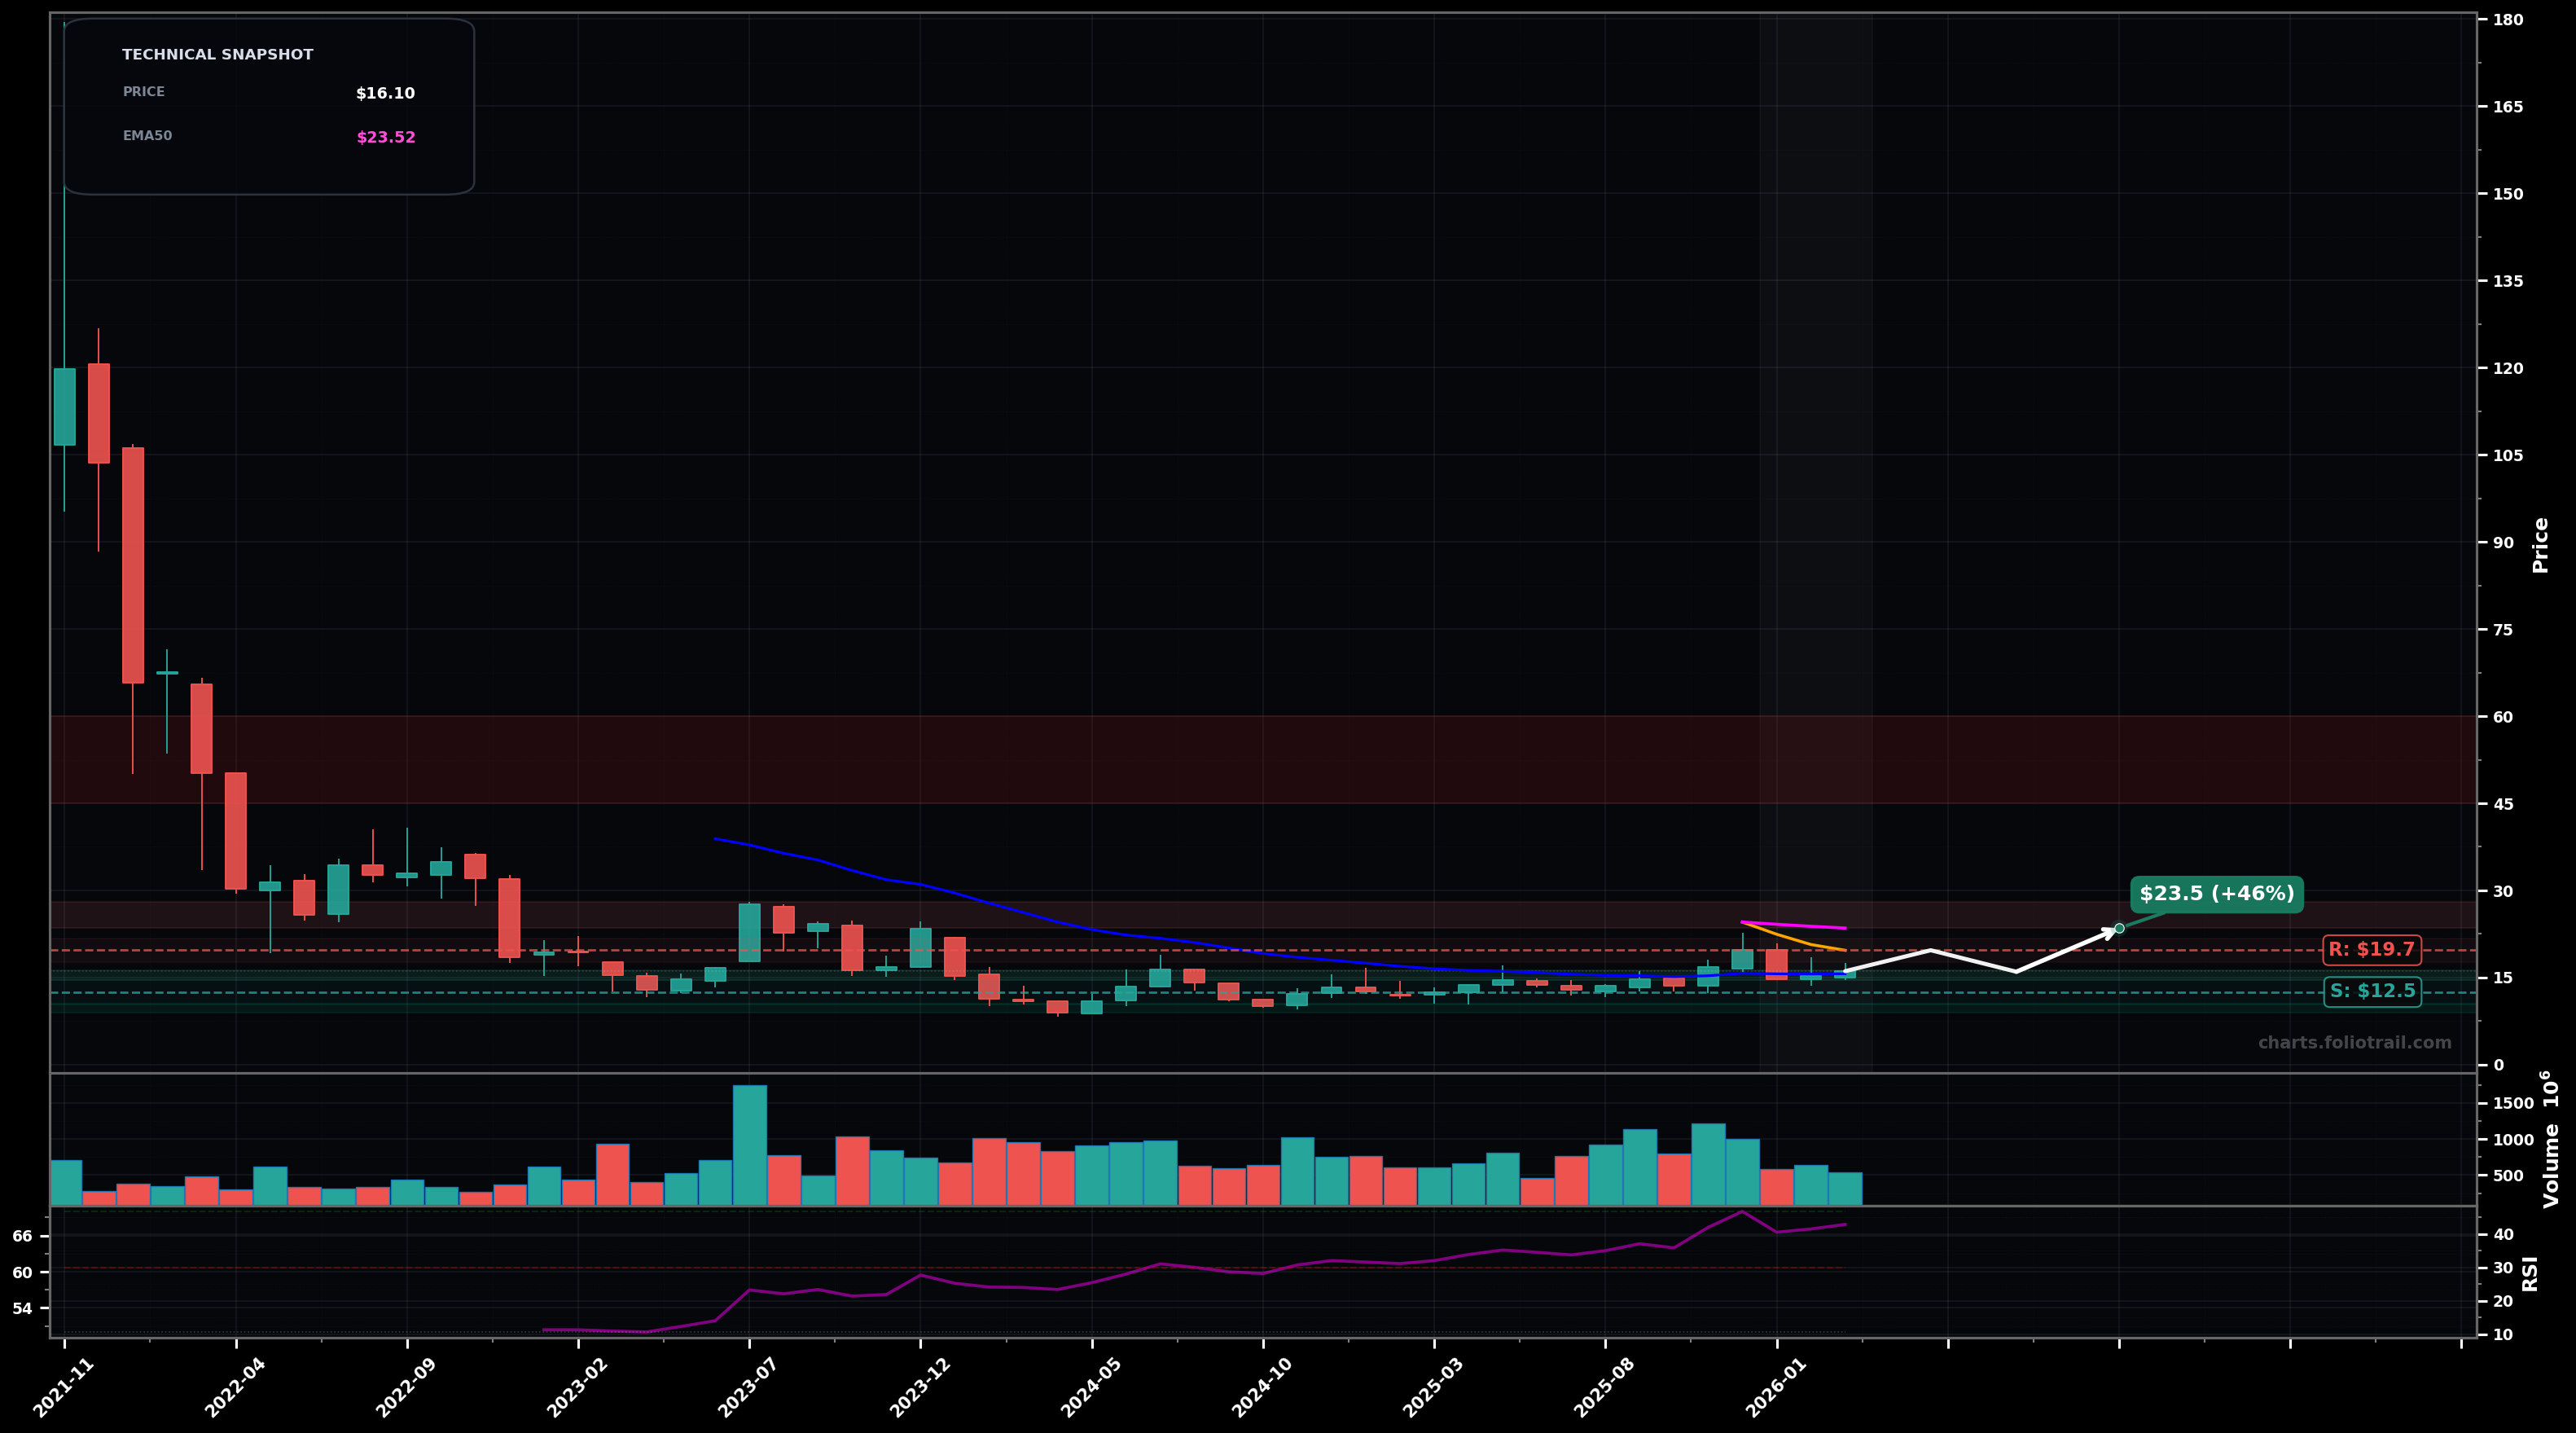
As of March 25, 2026, RIVN (Rivian Automotive, Inc. Class A Common Stock) is in a stabilized base state on the monthly chart, with a confidence level of 63%. Key support is at $12.5 and key resistance at $19.7. Monthly price ($16.10) is basing after a long decline; recent pop toward ~$20 failed and price slipped back under the $19–$20 area (SMA50 ~$19.69).
Base continues: price chops between ~$12.50 support and ~$19.70 resistance; eventual retest of range highs first, then decision near the EMA50 zone.
Range fails: rejection at ~$19–$20 leads to a breakdown below ~$12.50 and a move toward prior lows (capitulation leg).
Two monthly closes above $19.70 (SMA50) with follow-through toward $23.50 (EMA50).
Monthly close below $12.00 (range floor) would shift this into a renewed downtrend / breakdown risk.
Start near mid-range/last consolidation (~$15–$16), add at the swing low support band (~$12–$13), heavy add only on washout toward prior multi-year lows (~$9–$10.5).
Trim into major MA/structure resistance (EMA50 then higher supply zones); close if price returns to historically heavy supply from the early distribution area (multi-year overhead).
As of March 25, 2026, RIVN (Rivian Automotive, Inc. Class A Common Stock) is in a stabilized base state on the monthly chart with 63% confidence. Monthly price ($16.10) is basing after a long decline; recent pop toward ~$20 failed and price slipped back under the $19–$20 area (SMA50 ~$19.69).
On the monthly timeframe, RIVN has key support at $12.5 and key resistance at $19.7. The most likely scenario (bullish) targets $19.7 and $23.5, with a revert level at $16.0.
RIVN (Rivian Automotive, Inc. Class A Common Stock) is currently classified as stabilized base on the monthly chart, with 63% confidence. Confirmation requires: Two monthly closes above $19.70 (SMA50) with follow-through toward $23.50 (EMA50). This would be invalidated by: Monthly close below $12.00 (range floor) would shift this into a renewed downtrend / breakdown risk.
The most likely scenario (bullish) targets $19.7 and $23.5, with a revert level at $16.0. The alternative scenario (bearish) targets $12.0 and $9.00.
Multi-layer AI agents analyse 200+ stocks across daily, weekly, and monthly timeframes — producing market state classifications, price scenarios with targets, and position entry/exit levels. Updated every trading day after market close. No paywall. No sign-up required.
Built by Foliotrail.
All content on this website — including charts, analysis, price targets, support/resistance levels, and position zones — is generated entirely by AI and provided for educational and informational purposes only.
This is not financial advice. NEXUSNOIR VENTURES SL (the operator of this website) is not a registered investment adviser or broker-dealer. You should not make investment decisions based solely on this information. Always do your own research and consult a qualified financial advisor.
By continuing, you acknowledge that you have read and agree to our full disclaimer & terms of use and privacy policy.