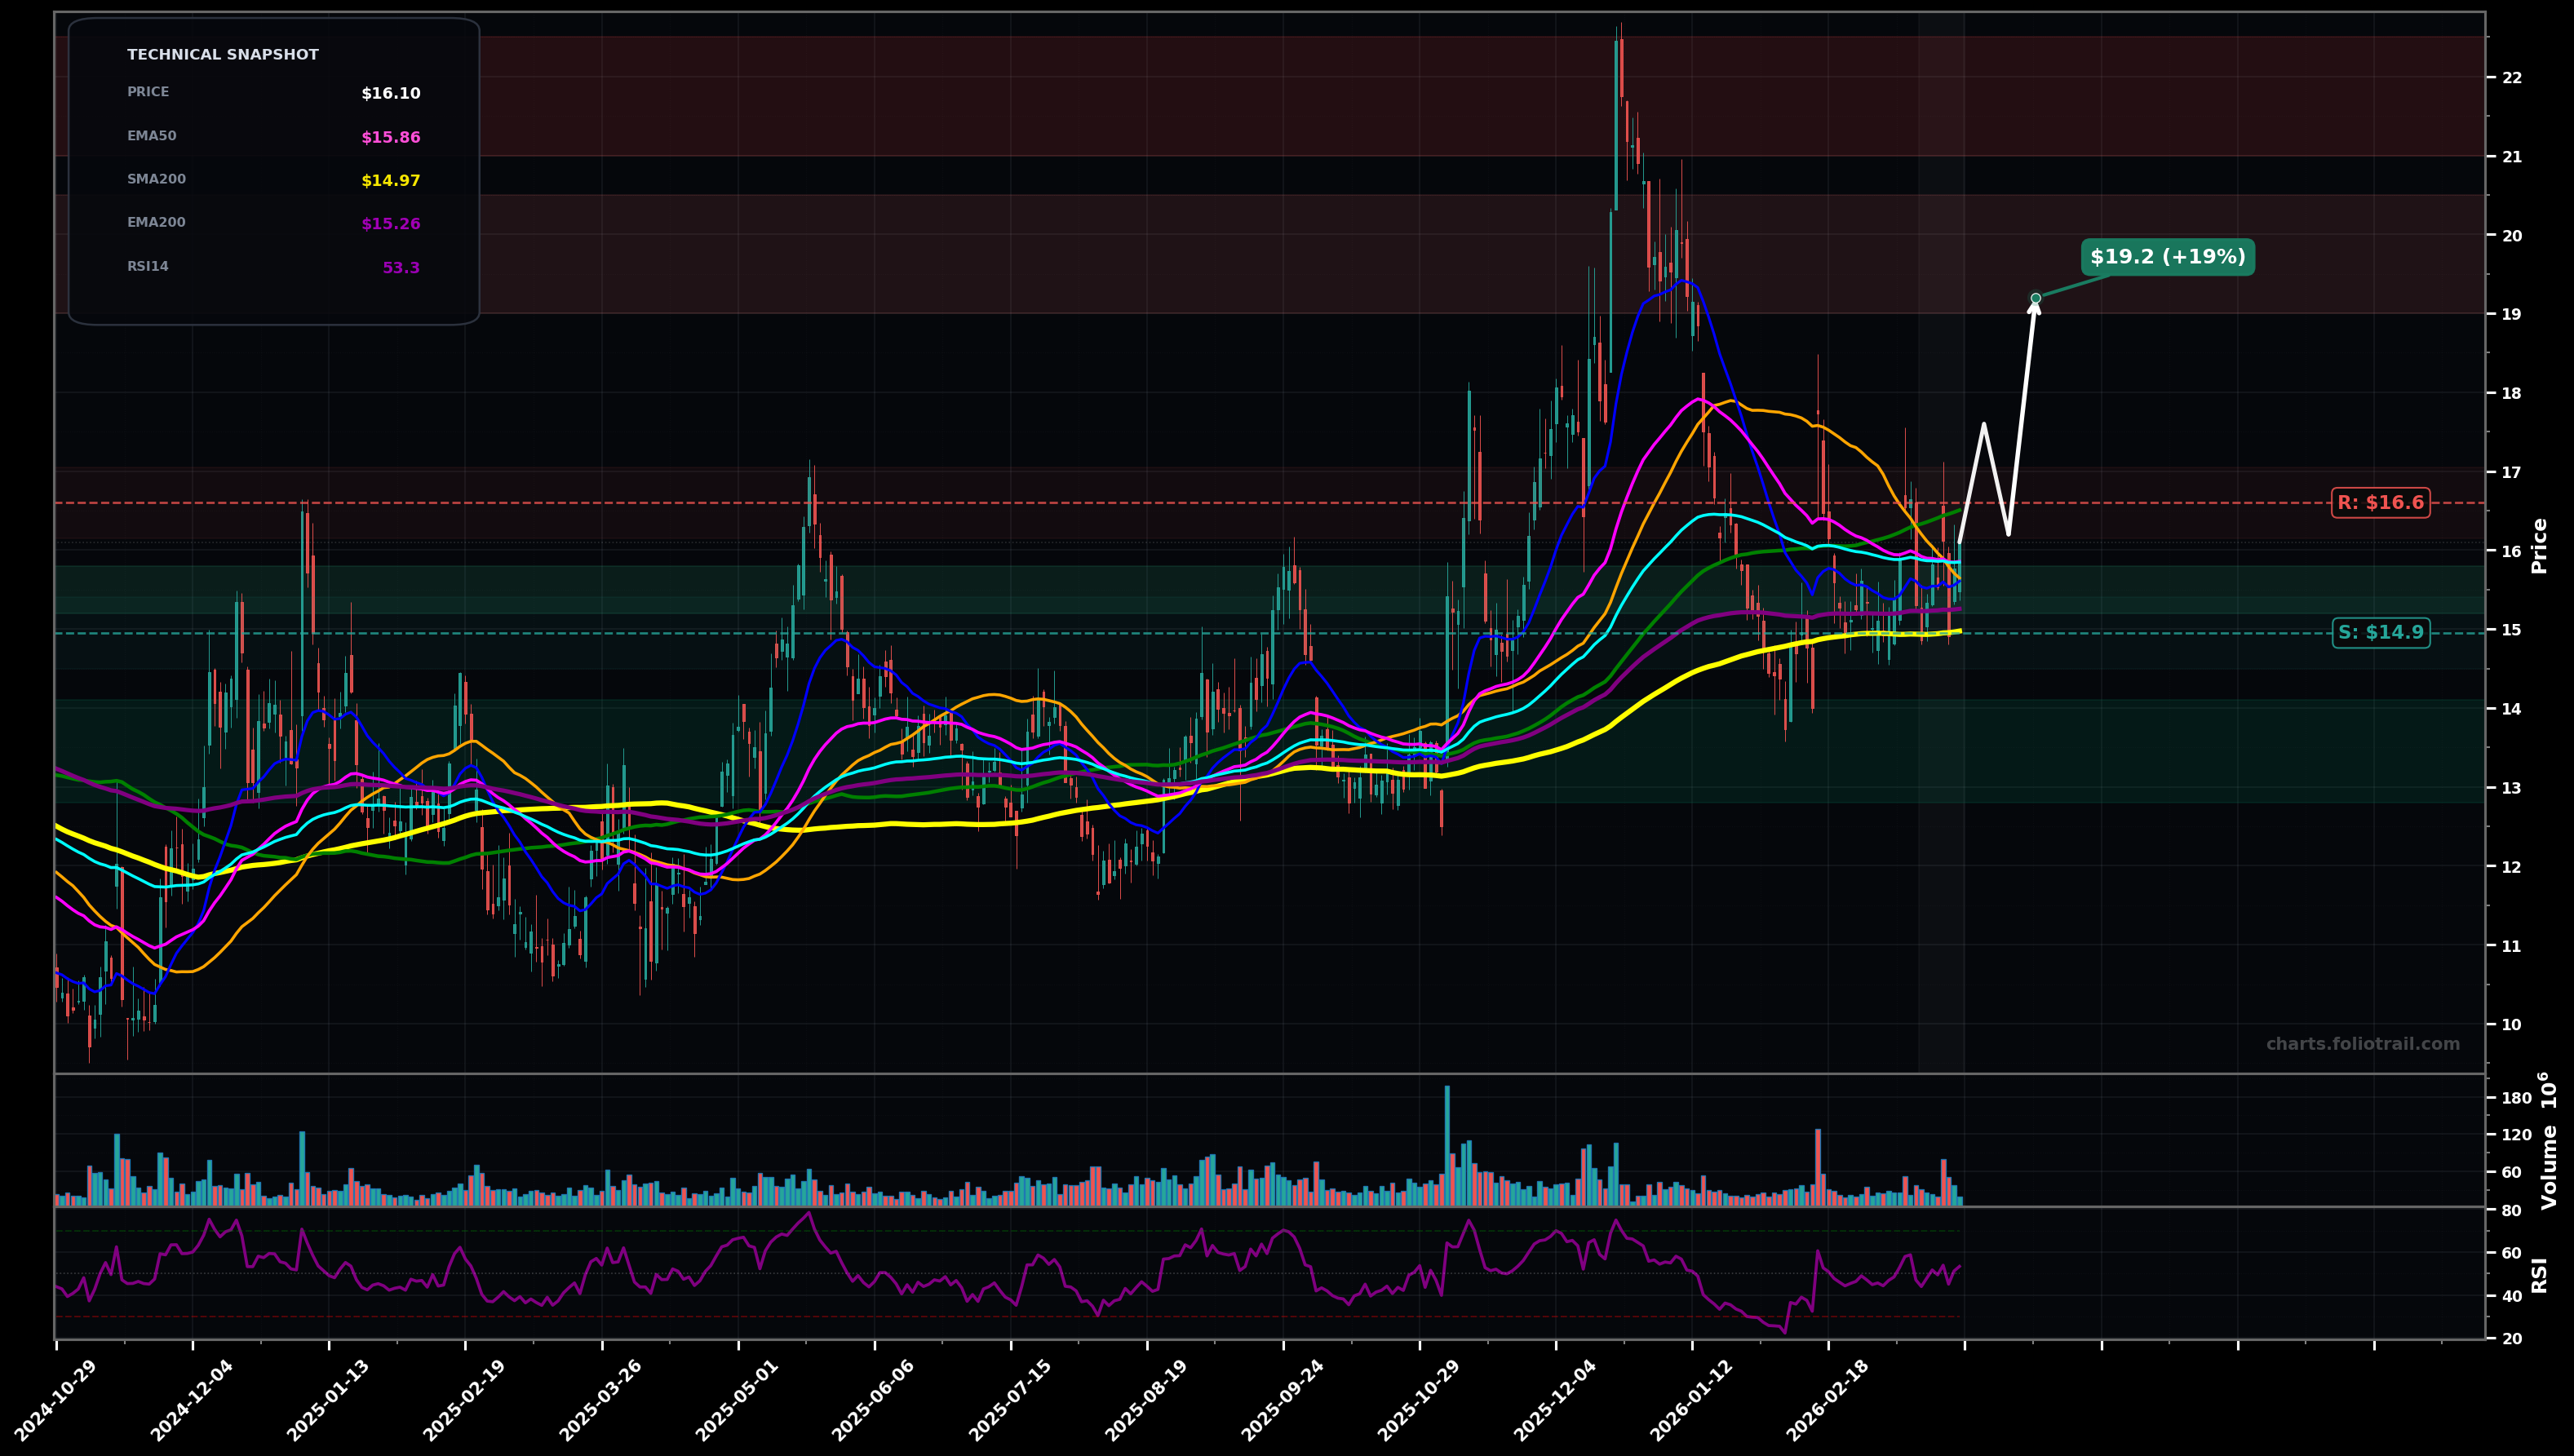
As of March 25, 2026, RIVN (Rivian Automotive, Inc. Class A Common Stock) is in a choppy range state on the daily chart, with a confidence level of 66%. Key support is at $14.9 and key resistance at $16.6. Price is consolidating around $16.10 with tight candles after a sharp drop from the ~$22 peak; multiple MAs are converging near $15.5–$16.5 and RSI is mid-range (~53).
Range resolves slightly bullish: hold above the $15.80–$16.00 MA cluster, then a push through $16.60 targets the post-base fib retracement zones; this fits an Elliott Wave view of a corrective base (Wave 4) potentially transitioning into an early Wave 5 attempt.
Range breaks down: failure to hold $14.95 triggers a retest of the February swing low area; Elliott Wave alternate is that the bounce was only a Wave B and price starts a Wave C down within a larger correction.
2+ daily closes holding above $16.60 (reclaim/hold over SMA100 ~$16.51 and recent range ceiling)
Daily close below $14.95 (loss of SMA200 ~$14.97 and range floor)
Start near MA-confluence/mean reversion ($15.2–$15.8), add on range-floor/SMA200 tests (~$15), heavy add only if breakdown reaches prior swing-low demand ($12.8–$14.1).
Trim into major overhead supply from the prior peak zone and likely fib retracements ($19–$22.5); full exit if price becomes extended beyond the prior blow-off high area ($23+).
As of March 25, 2026, RIVN (Rivian Automotive, Inc. Class A Common Stock) is in a choppy range state on the daily chart with 66% confidence. Price is consolidating around $16.10 with tight candles after a sharp drop from the ~$22 peak; multiple MAs are converging near $15.5–$16.5 and RSI is mid-range (~53).
On the daily timeframe, RIVN has key support at $14.9 and key resistance at $16.6. The most likely scenario (bullish) targets $17.6 and $19.2, with a revert level at $16.2.
RIVN (Rivian Automotive, Inc. Class A Common Stock) is currently classified as choppy range on the daily chart, with 66% confidence. Confirmation requires: 2+ daily closes holding above $16.60 (reclaim/hold over SMA100 ~$16.51 and recent range ceiling) This would be invalidated by: Daily close below $14.95 (loss of SMA200 ~$14.97 and range floor)
The most likely scenario (bullish) targets $17.6 and $19.2, with a revert level at $16.2. The alternative scenario (bearish) targets $14.0 and $12.8.
Multi-layer AI agents analyse 200+ stocks across daily, weekly, and monthly timeframes — producing market state classifications, price scenarios with targets, and position entry/exit levels. Updated every trading day after market close. No paywall. No sign-up required.
Built by Foliotrail.
All content on this website — including charts, analysis, price targets, support/resistance levels, and position zones — is generated entirely by AI and provided for educational and informational purposes only.
This is not financial advice. NEXUSNOIR VENTURES SL (the operator of this website) is not a registered investment adviser or broker-dealer. You should not make investment decisions based solely on this information. Always do your own research and consult a qualified financial advisor.
By continuing, you acknowledge that you have read and agree to our full disclaimer & terms of use and privacy policy.