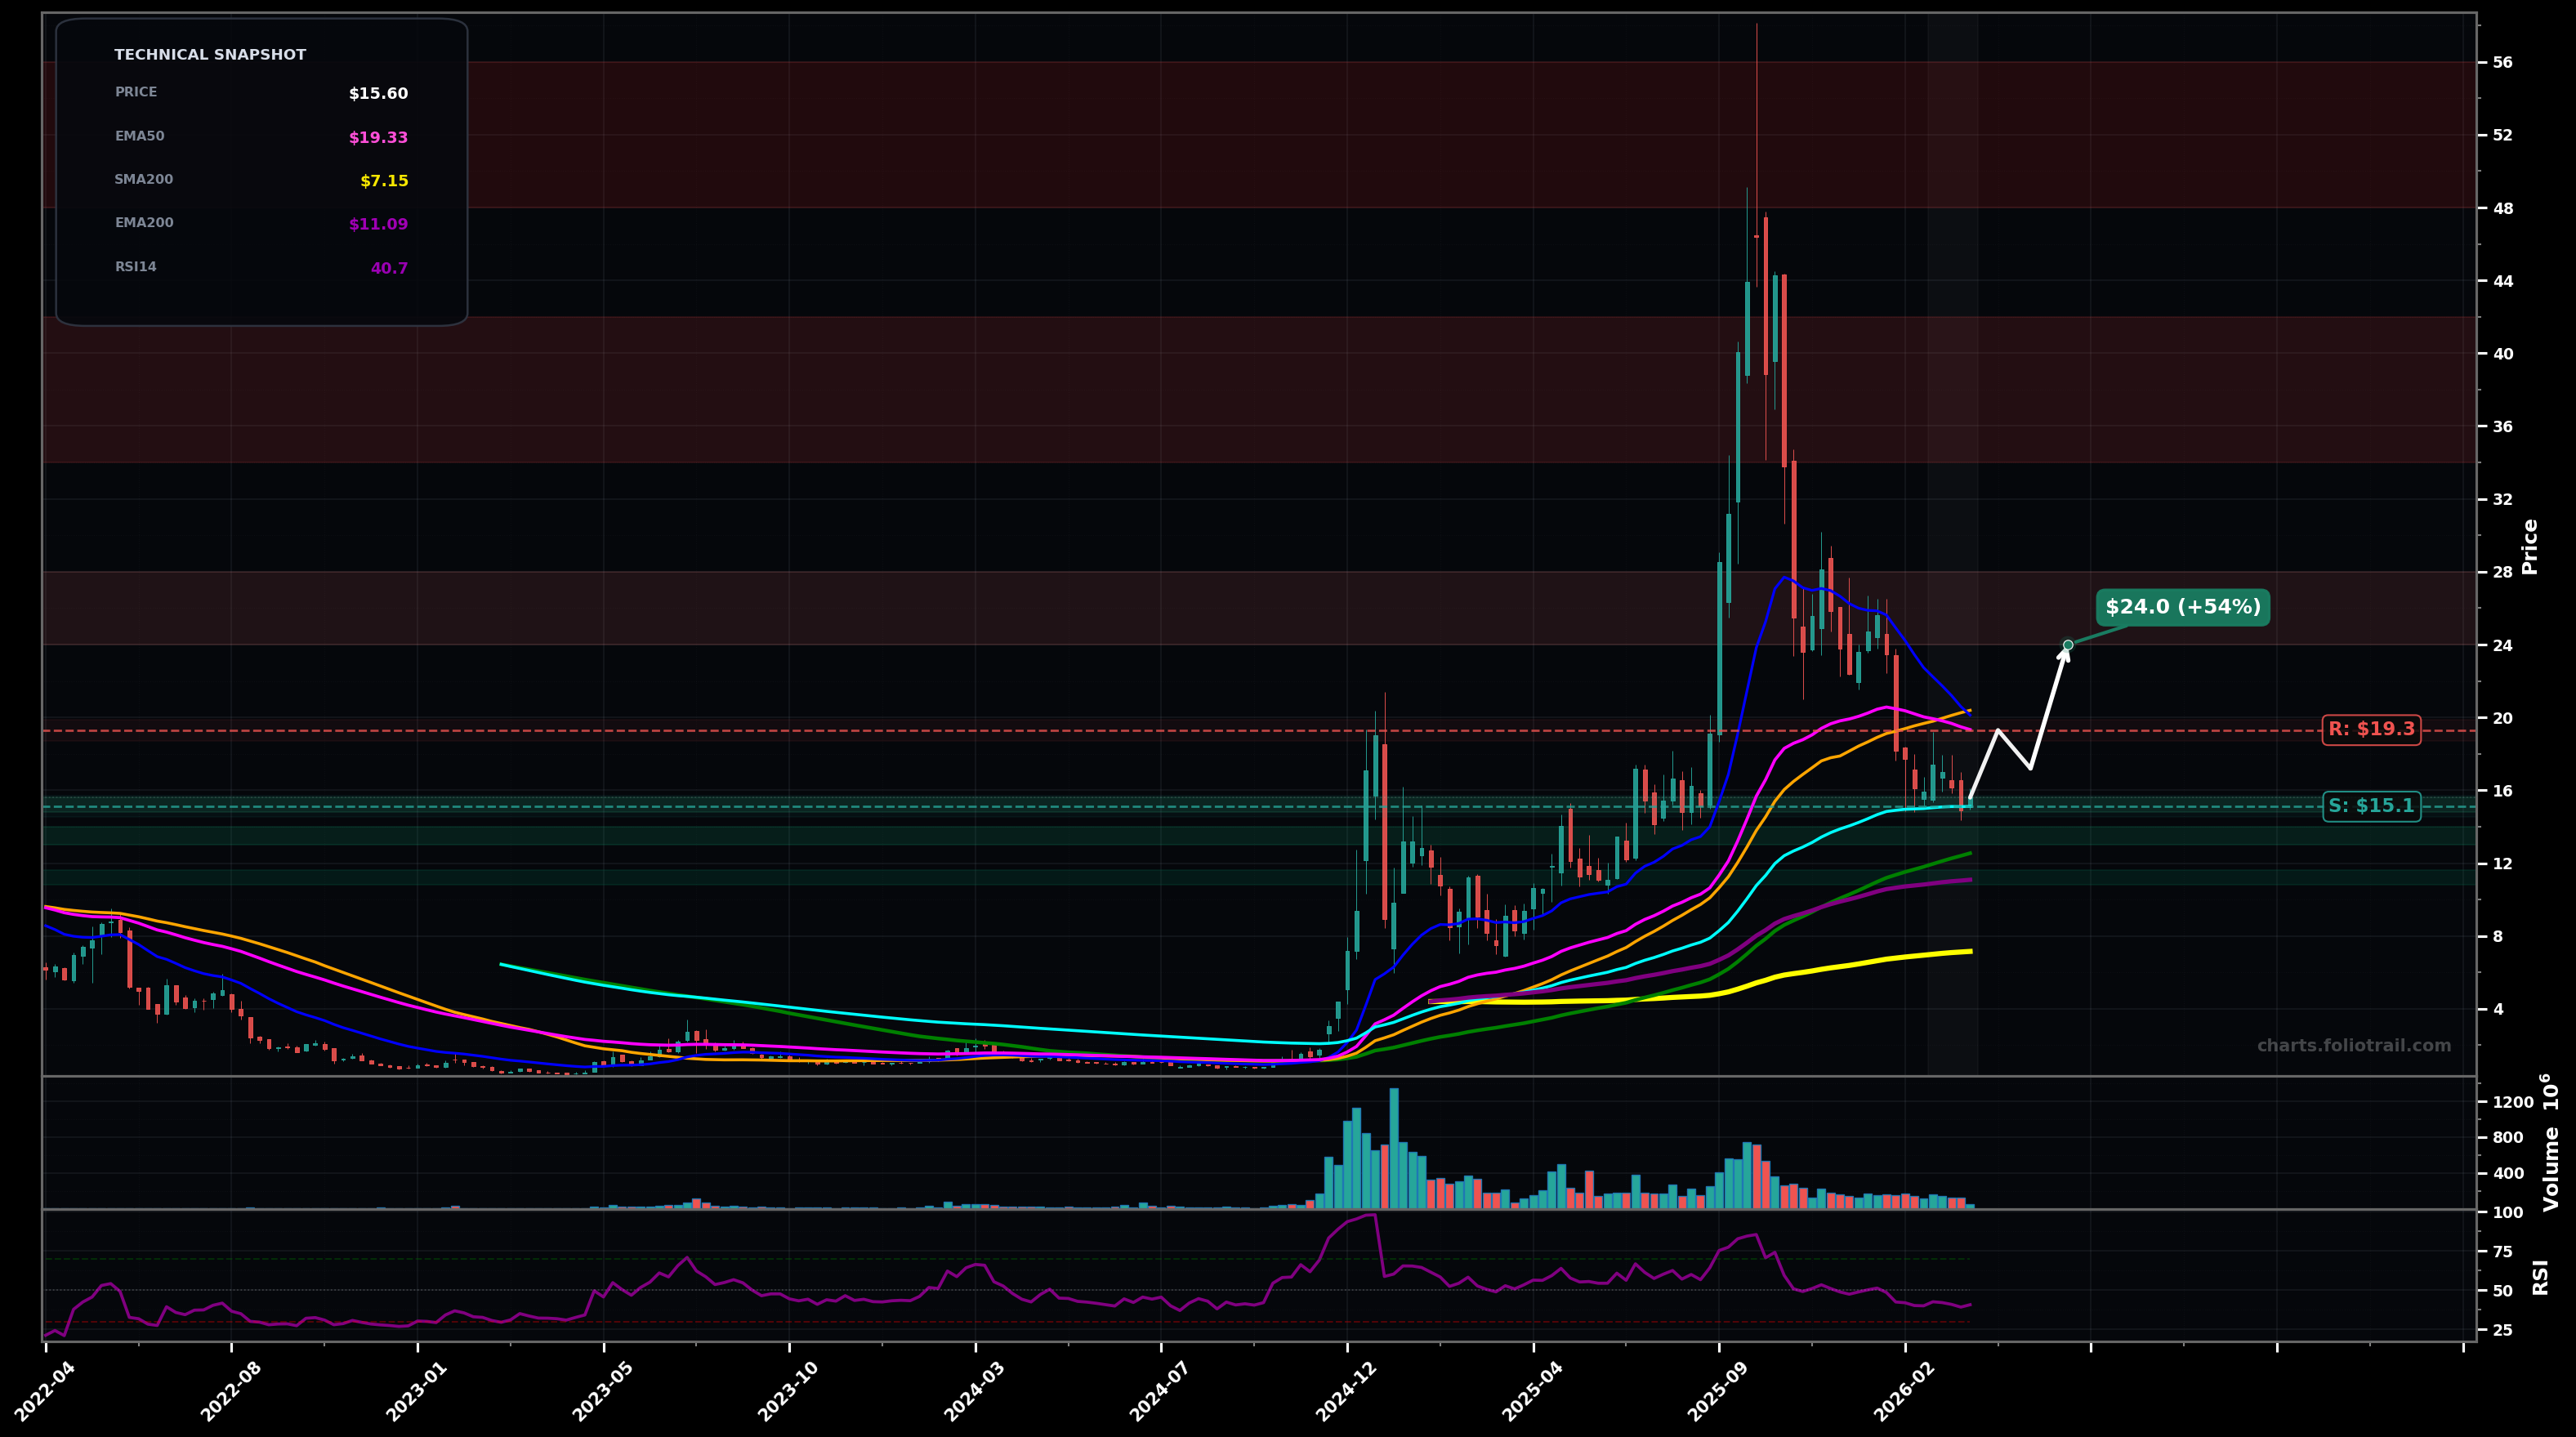
As of March 25, 2026, RGTI (Rigetti Computing, Inc.) is in a bottoming attempt state on the weekly chart, with a confidence level of 58%. Key support is at $15.1 and key resistance at $19.3. Weekly pullback/consolidation after a blow-off top; price ($15.60) is hovering just above EMA100 (~$15.11) but below EMA50 (~$19.33) and SMA50 (~$20.39).
Base-building above EMA100, then reclaim EMA50 to start a corrective up-leg (likely Elliott Wave ABC up inside a larger post-peak correction).
Failure to reclaim EMA50 leads to another leg down (wave C / wave 3 down) to test EMA200 and prior breakout area before a larger base forms.
2+ weekly closes back above $19.33 (EMA50) with follow-through toward $20.39 (SMA50).
Weekly close below $15.11 (EMA100) followed by acceptance under $14.50.
Start near EMA100 support; add on breakdown/retest of the $13 area; heavy add at EMA200/major prior base where mean-reversion odds improve.
Trim into Fibonacci-style retrace zones and prior supply; fully close into the prior blow-off/top region where overhead supply is highest.
As of March 25, 2026, RGTI (Rigetti Computing, Inc.) is in a bottoming attempt state on the weekly chart with 58% confidence. Weekly pullback/consolidation after a blow-off top; price ($15.60) is hovering just above EMA100 (~$15.11) but below EMA50 (~$19.33) and SMA50 (~$20.39).
On the weekly timeframe, RGTI has key support at $15.1 and key resistance at $19.3. The most likely scenario (bullish) targets $19.3 and $24.0, with a revert level at $17.2.
RGTI (Rigetti Computing, Inc.) is currently classified as bottoming attempt on the weekly chart, with 58% confidence. Confirmation requires: 2+ weekly closes back above $19.33 (EMA50) with follow-through toward $20.39 (SMA50). This would be invalidated by: Weekly close below $15.11 (EMA100) followed by acceptance under $14.50.
The most likely scenario (bullish) targets $19.3 and $24.0, with a revert level at $17.2. The alternative scenario (bearish) targets $13.0 and $11.1.
Multi-layer AI agents analyse 200+ stocks across daily, weekly, and monthly timeframes — producing market state classifications, price scenarios with targets, and position entry/exit levels. Updated every trading day after market close. No paywall. No sign-up required.
Built by Foliotrail.
All content on this website — including charts, analysis, price targets, support/resistance levels, and position zones — is generated entirely by AI and provided for educational and informational purposes only.
This is not financial advice. NEXUSNOIR VENTURES SL (the operator of this website) is not a registered investment adviser or broker-dealer. You should not make investment decisions based solely on this information. Always do your own research and consult a qualified financial advisor.
By continuing, you acknowledge that you have read and agree to our full disclaimer & terms of use and privacy policy.