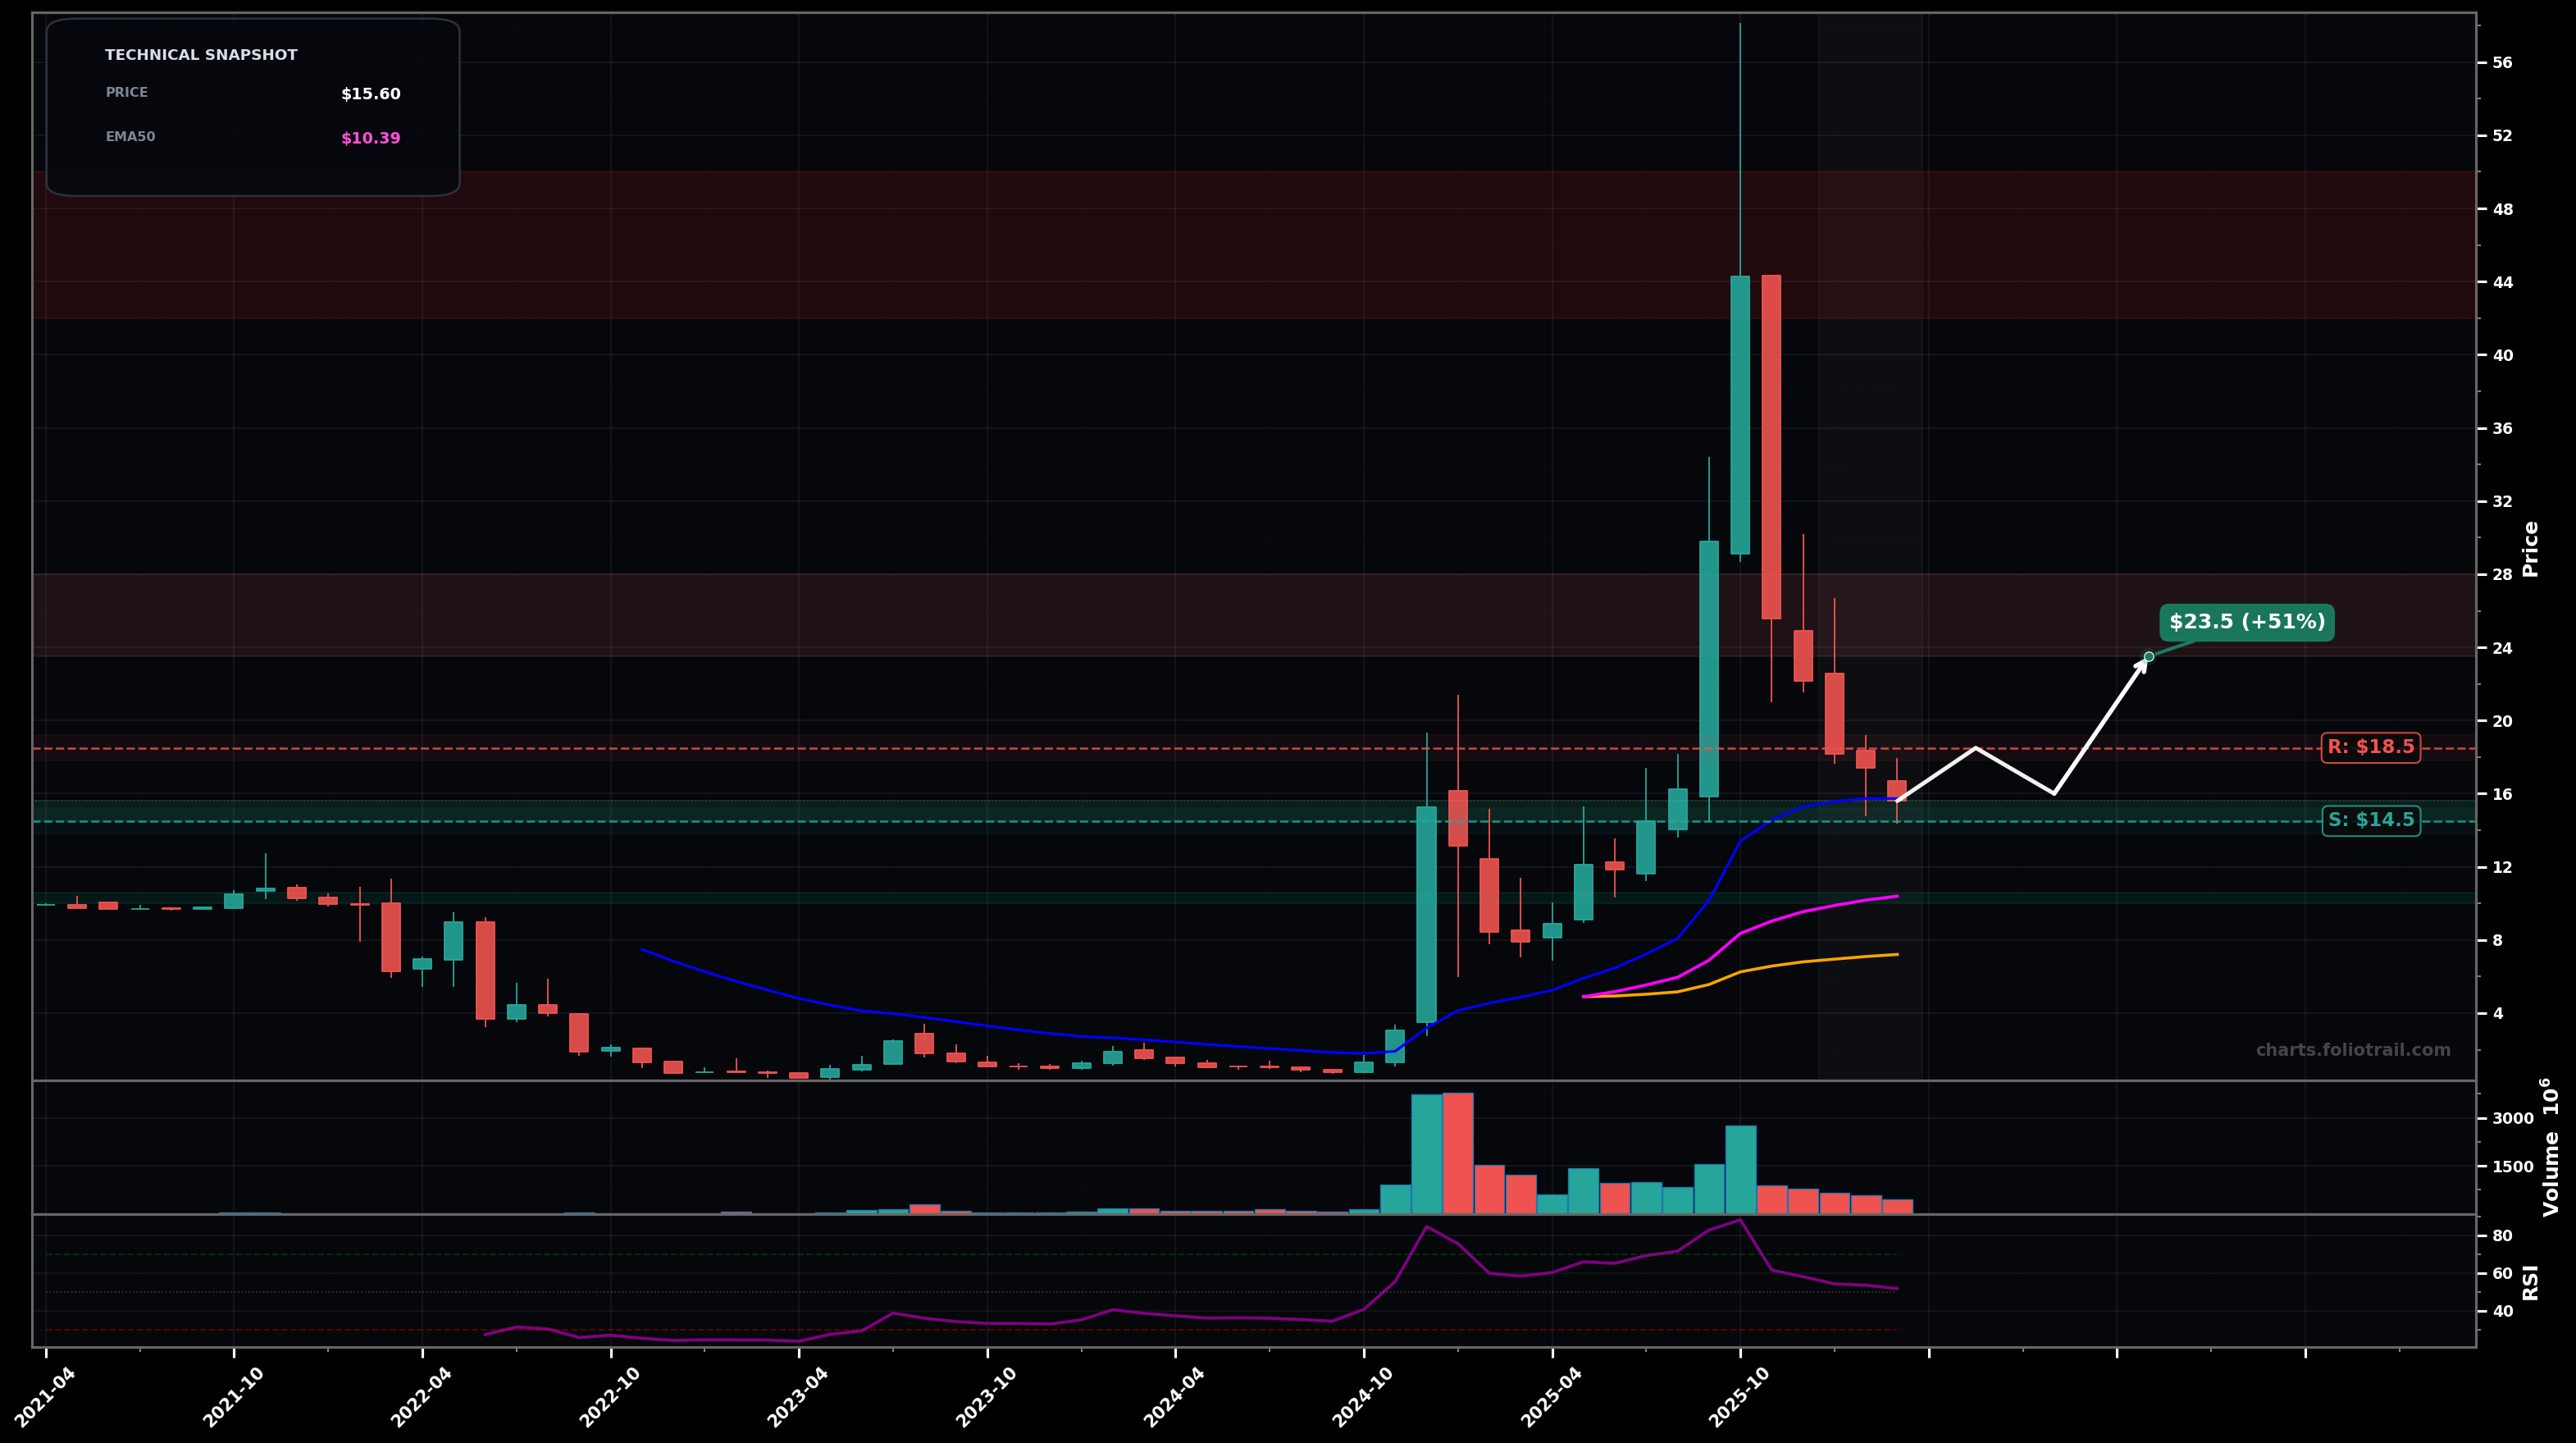
As of March 25, 2026, RGTI (Rigetti Computing, Inc.) is in a volatility expansion state on the monthly chart, with a confidence level of 72%. Key support is at $14.5 and key resistance at $18.5. After a blow-off spike to the mid-$40s, price is pulling back in a LH/LL sequence and is now chopping around the rising short-term EMA zone near the mid-$15s.
Base-build above the EMA20 area and attempt a bounce: price holds the $14.5-$15.5 demand, then grinds back toward the prior breakdown zone (likely LH) before deciding trend.
Continuation retrace of the blow-off: lose the $14.5 area, then unwind toward the rising medium-term averages and the prior breakout shelf from the base.
Monthly close below $14.50 would confirm volatility resolving bearishly (deeper retrace).
Monthly close above $20.00 would invalidate bearish-resolution risk and favor renewed upside expansion.
Start near current swing support/EMA20 area; add on 38.2%-50% style retrace zone of the last impulse; heavy add at the EMA50 (~$10.4) confluence and prior breakout shelf.
Trim into likely Fibonacci/structure resistances from the post-spike distribution zone; heavier trims as price approaches the blow-off supply ($30s) and full exit into the prior spike region ($40s-$50).
As of March 25, 2026, RGTI (Rigetti Computing, Inc.) is in a volatility expansion state on the monthly chart with 72% confidence. After a blow-off spike to the mid-$40s, price is pulling back in a LH/LL sequence and is now chopping around the rising short-term EMA zone near the mid-$15s.
On the monthly timeframe, RGTI has key support at $14.5 and key resistance at $18.5. The most likely scenario (bullish) targets $18.5 and $23.5, with a revert level at $16.0.
RGTI (Rigetti Computing, Inc.) is currently classified as volatility expansion on the monthly chart, with 72% confidence. Confirmation requires: Monthly close below $14.50 would confirm volatility resolving bearishly (deeper retrace). This would be invalidated by: Monthly close above $20.00 would invalidate bearish-resolution risk and favor renewed upside expansion.
The most likely scenario (bullish) targets $18.5 and $23.5, with a revert level at $16.0. The alternative scenario (bearish) targets $12.0 and $10.4.
Multi-layer AI agents analyse 200+ stocks across daily, weekly, and monthly timeframes — producing market state classifications, price scenarios with targets, and position entry/exit levels. Updated every trading day after market close. No paywall. No sign-up required.
Built by Foliotrail.
All content on this website — including charts, analysis, price targets, support/resistance levels, and position zones — is generated entirely by AI and provided for educational and informational purposes only.
This is not financial advice. NEXUSNOIR VENTURES SL (the operator of this website) is not a registered investment adviser or broker-dealer. You should not make investment decisions based solely on this information. Always do your own research and consult a qualified financial advisor.
By continuing, you acknowledge that you have read and agree to our full disclaimer & terms of use and privacy policy.