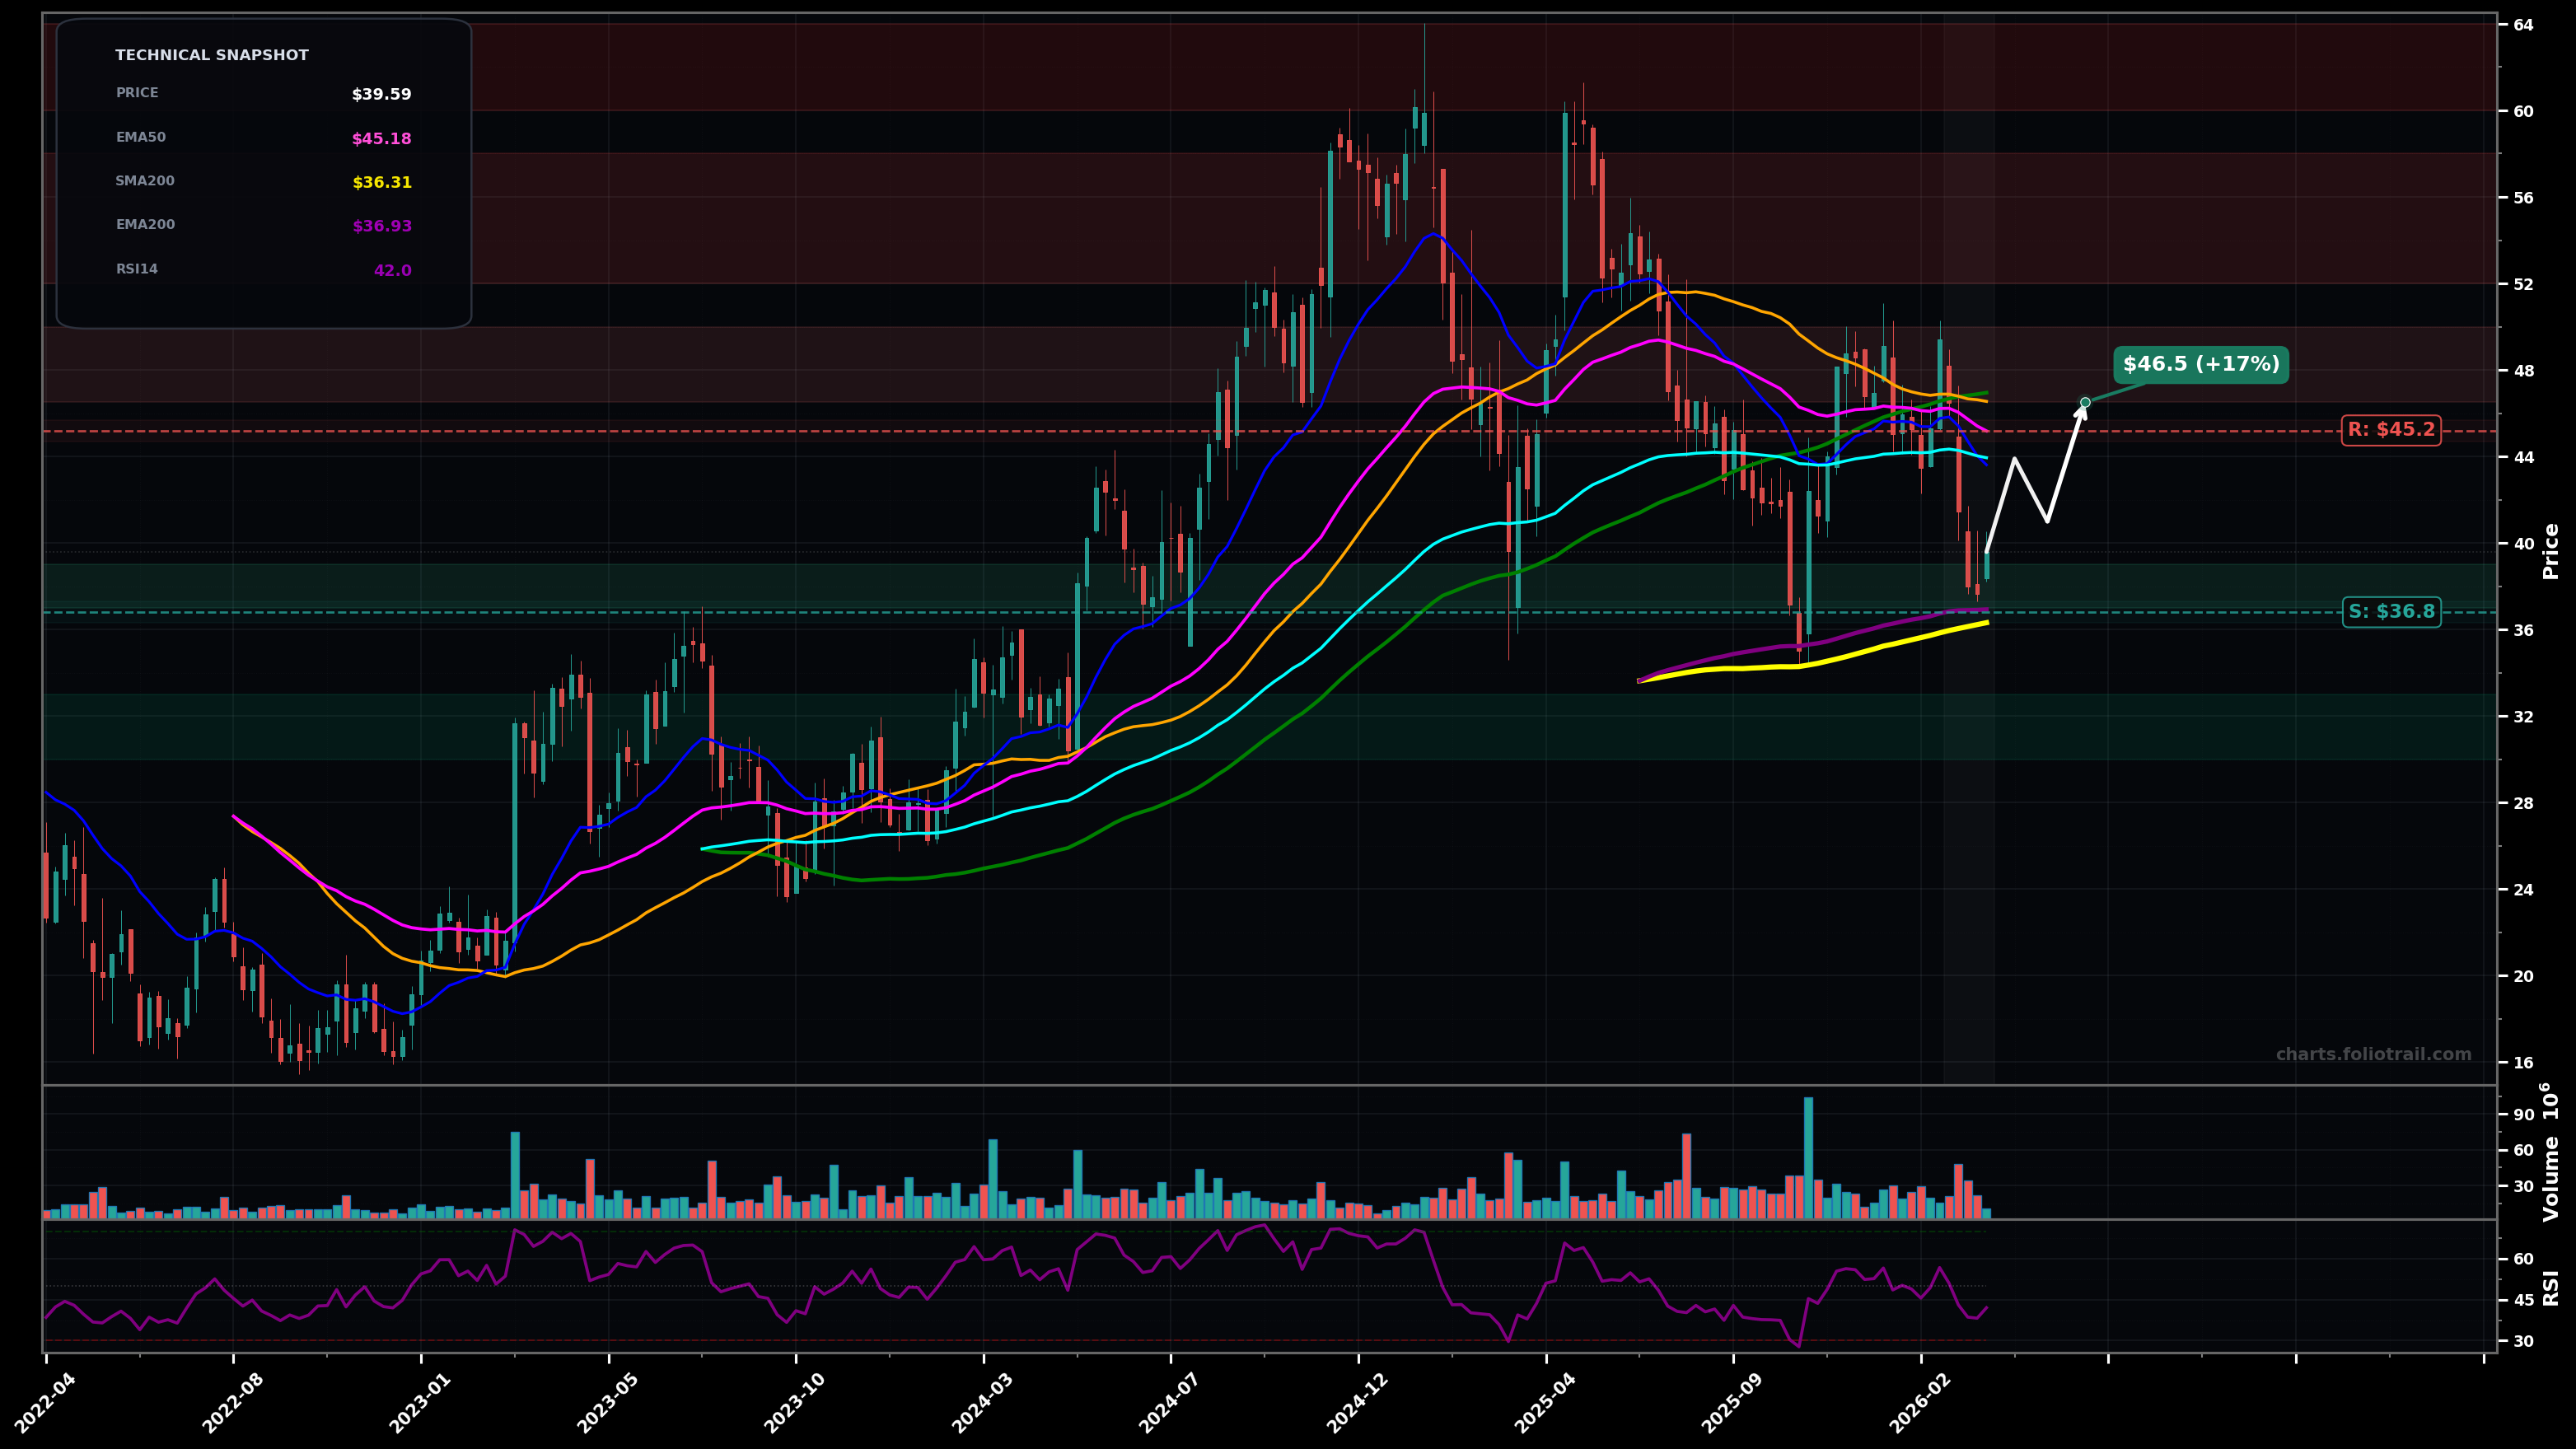
As of March 25, 2026, ONON (On Holding AG) is in a bottoming attempt state on the weekly chart, with a confidence level of 58%. Key support is at $36.8 and key resistance at $45.2. Weekly price ~$39.59 is below EMA50/EMA100 and under the $43-$46 MA cluster, while holding above the rising long-term SMA200/EMA200 near $36-$37; RSI ~42 shows weak momentum but not deeply oversold.
Base-building continues: price holds the $36-$37 major MA floor and mean-reverts upward toward the EMA100/EMA50 cluster; potential ABC corrective upswing within a larger downtrend.
Support fails: breakdown through the $36-$37 long-term MA shelf triggers a volatility expansion leg lower (next Elliott wave down), with prior demand zone retested from below.
Weekly close back above $43.94 (EMA100) and then a 2nd close holding above $45.18 (EMA50).
Weekly close below $36.30 (SMA200).
Start near current base support above EMA200/SMA200; add on controlled retest/undercut of $36-$37; heavy add only if a breakdown creates a deeper Fibonacci-style retrace into prior structure support.
Trim into the $46-$50 MA congestion/likely wave-(B) resistance; more trimming near prior supply $52-$58; fully close into prior highs/extension zone $60+ where reversal risk historically increases.
As of March 25, 2026, ONON (On Holding AG) is in a bottoming attempt state on the weekly chart with 58% confidence. Weekly price ~$39.59 is below EMA50/EMA100 and under the $43-$46 MA cluster, while holding above the rising long-term SMA200/EMA200 near $36-$37; RSI ~42 shows weak momentum but not deeply oversold.
On the weekly timeframe, ONON has key support at $36.8 and key resistance at $45.2. The most likely scenario (bullish) targets $43.9 and $46.5, with a revert level at $41.0.
ONON (On Holding AG) is currently classified as bottoming attempt on the weekly chart, with 58% confidence. Confirmation requires: Weekly close back above $43.94 (EMA100) and then a 2nd close holding above $45.18 (EMA50). This would be invalidated by: Weekly close below $36.30 (SMA200).
The most likely scenario (bullish) targets $43.9 and $46.5, with a revert level at $41.0. The alternative scenario (bearish) targets $34.0 and $30.0.
Multi-layer AI agents analyse 200+ stocks across daily, weekly, and monthly timeframes — producing market state classifications, price scenarios with targets, and position entry/exit levels. Updated every trading day after market close. No paywall. No sign-up required.
Built by Foliotrail.
All content on this website — including charts, analysis, price targets, support/resistance levels, and position zones — is generated entirely by AI and provided for educational and informational purposes only.
This is not financial advice. NEXUSNOIR VENTURES SL (the operator of this website) is not a registered investment adviser or broker-dealer. You should not make investment decisions based solely on this information. Always do your own research and consult a qualified financial advisor.
By continuing, you acknowledge that you have read and agree to our full disclaimer & terms of use and privacy policy.